
KGS Home > Geologic Hazards
Seismic Hazard Assessment in western Kentucky
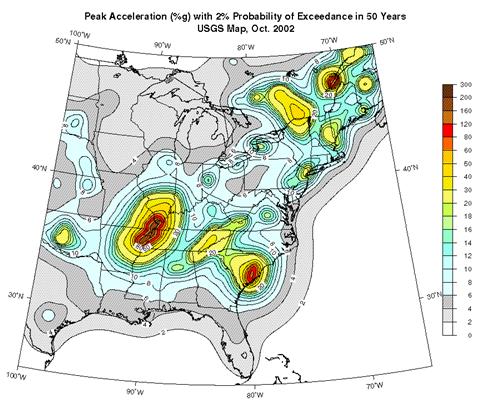
The Federal government uses seismic hazard maps produced by the U.S. Geological Survey for seismic safety design. The maps currently being used show the ground motion with 2 percent probability of being exceeded (PE) in 50 years, or once in about 2,500 years. The maps predict very high ground motion for western Kentucky , the Jackson Purchase Region in particular. They show peak ground acceleration of about 1.0g (or 1 times the acceleration due to gravity) near Paducah . The maps were used for seismic design in the 2000 International Building Code (IBC-2000) and the 2000 International Residential Code (IRC-2000). The design peak ground acceleration (PGA) is about 0.6g near Paducah according to IBC-2000 and IRC-2000. Currently, the highest PGA used in building design in California is about 0.4g (the 1997 Uniform Building Code [UBC-97]). Thus, the use of the USGS hazard maps has resulted in higher seismic design requirements in the Paducah area than anywhere in California , even though it is well documented that California has higher seismic risk. The high design ground motions have caused many problems in western Kentucky . For example, it would not be feasible for the U.S. Department of Energy to obtain a permit from Federal and State regulators to construct a landfill at a facility near Paducah if the USGS 2 percent PE in 50 years maps are used. The Structural Engineers Association of Kentucky also found that if IRC-2000 is adopted in Kentucky without a modification, constructing residential structures in westernmost Kentucky will be impossible without enlisting a design professional. The high design ground motion is also one of the reasons that Kentucky lost the chance to compete with Ohio for a new centrifuge facility ($2 billion).
Although it was a complicated process to develop the seismic design maps from the seismic hazard maps (see the Kentucky NEHRP Seismic Hazard and Design Maps Workshop Proceedings ), a process that involve earth scientists, engineers, elected officials, and others, the higher design ground motions in Paducah than in San Francisco are not consistent with the basic geological and seismological sciences ( Table 1 ). It does not make sense that the design ground motion in Paducah is about 30 to 50 percent higher than that in San Francisco from point of view of the geological and seismological sciences. Although mitigating risks to society from earthquakes involves economic and policy issues (Stein, 2004), seismic hazard assessment must be the basis. There is something wrong with the seismic hazard maps being produced.
Table 1. A comparison of design ground motion, geology, and seismology between San Francisco and Paducah .
|
San Francisco , California |
Paducah , Kentucky | ||
Design |
<=0.4g PGA |
<=0.7g PGA |
>0.4g PGA |
>1.0g PGA |
Geology |
San Andreas Fault |
New Madrid faults |
||
Seismology |
High earthquake activity |
Low earthquake activity |
||
Our research shows that miscommunication about or misunderstanding of the seismic hazard maps is the main reason that the New Madrid area, including Paducah , has a higher design ground motion. The ground motion maps with 2 percent PE in 50 years are risk maps by definition (see Seismic Hazards and Risk ). These maps have been called seismic hazard maps, however (see the national seismic hazard maps at http://www.earthquake.usgs.gov/hazmaps ). Furthermore, in the New Madrid Seismic Zone, the true meaning of the peak acceleration with 2 percent PE in 50 years is that that peak acceleration has about an 80 percent chance of not being exceeded if a characteristic earthquake of M7.7 occurs (see Summary of USGS-KGS Meeting on Seismic Hazard Assessment in Western Kentucky, and Comment on How Can Seismic Hazard around the New Madrid Seismic Zone Be Similar to that in California? by Arthur Frankel). The meaning that has been incorrectly communicated, however, is that there is a 2 percent probability of this peak acceleration or greater occurring one or more times in 50 years.
The confusion about the hazard maps is caused by the method being used for the national hazard mapping (PSHA).
Probabilistic seismic hazard mapping is a confusing topic, since most people, including some of its practitioners, have difficulty understanding the basic principles of PSHA (see Response to Comment by R.M.W. Musson ). Our research (see Communicating with Uncertainty: A Critical Issue with Probabilistic Seismic Hazard Analysis; Comparison Between Probabilistic Seismic Hazard Analysis and Flood Frequency Analysis; Response to Comment by T.L. Holzer; Comment on J.U. Klügel's: Problems in the Application of the SSHAC Probability Method for Assessing Earthquake Hazards at Swiss Nuclear Power Plants ) also shows that PSHA is a mathematical extrapolation from the temporal (time-domain) characteristics of earthquakes and the spatial characteristics of ground motion and has an unclear physical basis and an obscure uncertainty. It is difficulty to determine a correct choice using PSHA.
Other reasons for higher design ground motion in the New Madrid area are large uncertainties in sources (faults), earthquake magnitude, frequency, and ground-motion attenuations. Although it has not been proven that the active faults of the New Madrid Seismic Zone extend into the Jackson Purchase Region of western Kentucky , such extension was considered to be the case in many seismic hazard assessments, including the ones by USGS. The postulated northeastern extension of the active faults of the New Madrid Seismic Zone also has a significant impact on siting of critical facilities in the Jackson Purchase Region. The best information for determining seismically active zones and faults is seismicity. Until recently, the lack of a dense seismic network in the area has precluded any definitive determination of the northern boundary of the New Madrid Seismic Zone. A dense seismic network has recently been deployed in the Jackson Purchase Region for better monitoring and locating of earthquakes. A preliminary result has been published ( Observed Seismicity [Earthquake Activity] in the Jackson Purchase Region of Western Kentucky : January through June 2003 ).
Even though the New Madrid Seismic Zone is the most active in the central and eastern United States , only a couple dozen earthquakes with magnitude larger than M4.0 have occurred there in the past 200 years. Only one strong historical event (6.0 < M < 6.5), the 1843 Marked Tree, Ark. , earthquake, and the 1811-12 New Madrid earthquakes (7.0 < M < 8.0) have occurred in the New Madrid Seismic Zone. This earthquake catalog is too short to be sufficient for constructing a reliable earthquake magnitude and frequency relationship.
All the attenuation relationships currently available for the central United States are based on theoretical models. This results in differences in ground-motion uncertainties in both median and standard deviation for the New Madrid Seismic Zone. The median ground motions for California vary only slightly between the different attenuation relationships. For example, PGA from four attenuation relationships ranges from 0.30 to 0.38g for an M7.8 earthquake at 15 km epicentral distance in San Francisco . The median PGA's vary between 0.46 and 1.20g for an M7.7 earthquake at 15 km epicentral distance in the New Madrid Seismic Zone, however, depending on which of six attenuation relationships is used. The theoretical models also predict higher standard deviations for the central United States . The standard deviations are about 0.3 to 0.5 in California and 0.6 to 0.8 in the central United States.