PART I. MULTIPLE
CHOICE
- A
- A
- D
- C
- E
- C
- B
- A
- D
- B
- E
- D
- B
- B
- C
PART
II. PROBLEM SOLVING
#1.
(a) Outputs/Inputs = Productivity
Given: Outputs = 1500 and Productivity = 2.344 loaves per labor-hour
Thus, Labor-hours = 1500/2.344 = 640 hours
Given: each worker works 160 hours per month
Thus, number of workers used = 640/160 = 4
(b) Multifactor productivity = Outputs/(Labor cost + Utility cost + Ingredients cost)
Output = 1500 loaves
Labor cost = 640 hours x $8
Utility cost = $500
Ingredients cost = 1500 x $0.35
Thus, multifactor productivity = 1500/6145 = 0.244
(c) New output = 1500 x (1+25%) = 1875
Labor-hours needed = 1875/2.344 = 800 hours
Number of workers needed = 800/160 = 5
è Need to add 1 worker
(d) Multifactor productivity = Outputs/(Labor cost + Utility cost + Ingredients cost)
Output = 1875 loaves
Labor cost = 800 hours x $8
Utility cost = $500
Ingredients cost = 1875 x $0.35
Thus, multifactor productivity = 1875/7556.25 = 0.248
(e) Change in productivity = (0.248-0.244)/0.244 = 1.6%
#2.
(a) TC_manual = $15000 + ($350+$350) x 200 = $155000
TC_semiautomatic = $35000 + ($330+$270) x 200 = $155000
TC_automatic = $80000 + ($350+$130) x 200 = $176000
Either the manual and semi-automatic production method gives the lowest total costs. C&A can choose one of these methods.
(b) From (a), when Q1=200 is the indifference point between manual and semi-automatic
Let Q2 be the indifference point between semiautomatic and automatic method
i.e., 35000 + 600 Q2 = 80000 + 480 Q2
Q2 = (80000-35000)/(600-480) = 375
Thus, 1 <= Q <= 200 choose manual
200 <= Q <= 375 choose semiautomatic
Q >= 375 choose automatic
(c)
(d) R = 800 Q
(e) Let Q be the break-even point when revenue equals to total costs
i.e., 800 Q = 15000 + 700 Q
Q = 15000/(800-700) = 150
(f) Profit = Revenue – Total costs
= 800 x 1000 – (15000 + 700 x 1000)
= 800000 – 715000 = 85000
#3.
(a) The quality characteristic here is the “number of non-conformities” which is counted on a discrete scale. Thus, a control chart for attribute should be used. The number of non-conformities is counted daily. Thus, a c-chart should be used.
(b) CL = (52 + 27 + 35 + 44 + 55)/5 = 42.6
UCL = 42.6 + 3 ![]() = 62.2
= 62.2
LCL = 42.6 - 3 ![]() = 23.0
= 23.0
(c) The chart is defined by a center line of 42.6, an upper control limit of 62.2 and a lower control limit of 23:
(d) 65 nonconformities go beyond the UCL of 62.2, indicating that a quality problem exists that needs special attention.
#4.
(a)
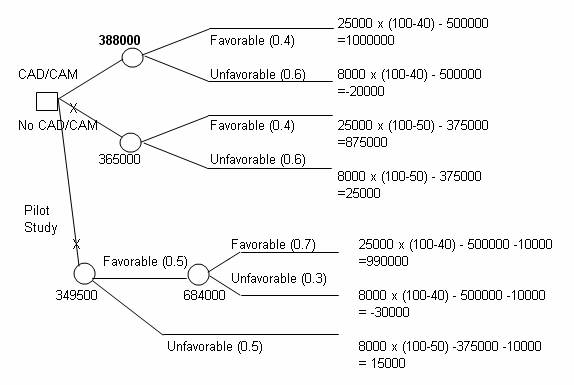
(b) C&A should produce and market a new line of cellular phone by purchasing a CAD/CAM directly. The expected profit is $388,000.