Systems Analysis
- What is process modeling?
- How to use data flow diagram (DFD) and data dictionary for process modeling?
- What is logic modeling?
- How to use structured English, decision tables, and decision trees for logic modeling?
- What is a systems proposal and its role in systems analysis?
Analysis II --
Requirements structuring
To organize information gathered during requirements
determination into a meaningful representation of process, data, and logic views
of the information systems
To represent the functions/processes which capture, manipulate, store, and distribute data between a system and its environment and between components within a system, i.e., what are involved in converting data into information?
A technique for graphically depicting, at levels of increasing detail, the transformation of data into information by processes
Gane & Darson’s 4 symbols (Figure 9.1)
1. Data flow -- data moves from one place of the system to another
2. Data store -- data at rest
3. Process -- work/actions performed on data
4. External entity -- origin/destination of the data
Steps in developing
DFDs (Figure 9.2)
- List business activities to identify processes, external entities, data flows, and data stores
- Create a context diagram
- Create the next level diagram
- Create child diagrams
- Check for errors
- Develop
a physical DFD
An example:
Step 1: A list of business activities
1. Students place orders by filling out a form.
2. Order department receives orders by mail, fax, or personal delivery.
3. Order department processes orders by verifying that all order information is accurate and that the item ordered is currently available in stock.
4. Information from valid orders is used to update the student and item master records.
5. Valid orders are forwarded to the shipping department to be filled.
6. A receipt is produced notifying the student the status of his/her order.
Step 2: Context diagram
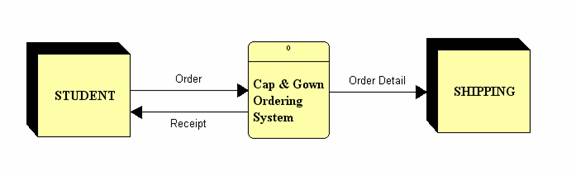
Step 3: Level-0 diagram
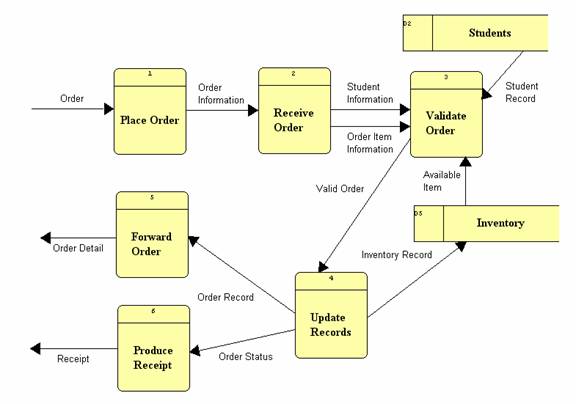
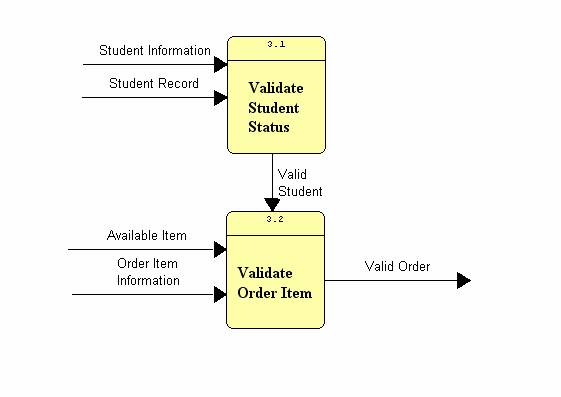
Step 4: Level-1 diagram
Step 5: Check for error (Figures 9.5 and 9.6)
DFD rules
Internal consistency rules
|
Elements |
Rules |
|
DFD |
· At least one process · No more than 9 processes |
|
Context diagram |
· Contains only one process numbered 0 · At least one input from an external entity and one output to an external entity |
|
External entity |
· Appears only on the context diagram · Connected to a process · Labeled with noun phrase |
|
Process |
· At least one input data flow and one output data flow · Inputs to process are different from outputs of that process · Labeled with verb phrase |
|
Data flow |
· Has only one flow direction · No split · No loop · Labeled with noun phrase |
|
Data store |
· An interface between two processes · Labeled with noun phrase |
Hierarchical consistency rules
|
Elements |
Rules |
|
DFD |
· A parent diagram must exist unless it is a context diagram |
|
Process |
· Decompose to either another diagram or a primitive process specification · Numbered with respect to its parent |
|
Data flow |
· An input (output) data flow on a parent diagram must appear on a child diagram as input (output) · An input (output) data flow on a child diagram must appear on a parent diagram as input (output) |
|
Data store |
· Decompose to either a file definition or a record definition |
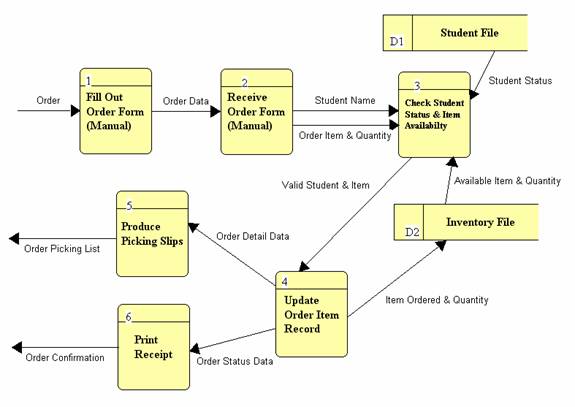
Step 6: Develop a
physical DFD
Logical vs Physical
DFDs (Figure 9.8)
|
Features |
Logical |
Physical |
|
Model |
How the business operates |
How the system will be implemented |
|
Process |
Business activities |
Programs, program modules, manual procedures |
|
Data store |
Collections of data |
Physical files and databases, manual files |
|
Type of data store |
Permanent data collections |
Master files, transaction files |
|
System controls |
Business controls |
Controls for data validation, record status, system security |
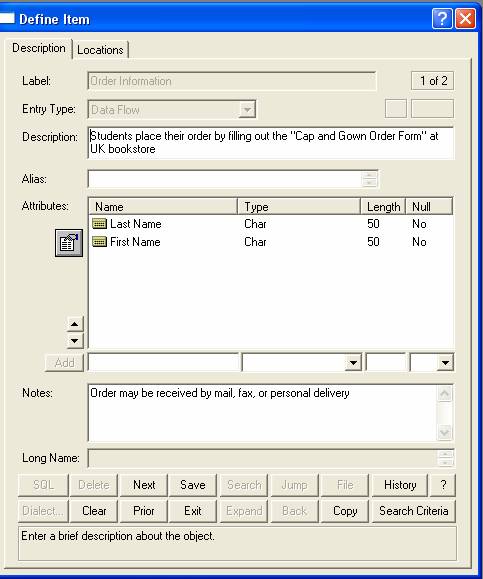
A documentation and reference of the metadata: data on
- Data flow (Figure 10.3)
- Data structure (Figure 10.5)
- Data elements (Figure 10.7)
- Data stores (Figure 10.12)
à to promote understanding of the data of the system
by collecting, coordinating, and confirming what a specific data term means to
different people in the organization.
|
Data types |
Specific description |
|
|
Data flow |
|
|
|
Data structure |
|
|
|
Data element |
|
|
|
Data store |
|
|
Data flow description example:
To represent the internal structure and functionality of the processes represented on DFDs, i.e., how do data be converted to information?
relies on action verbs and noun phrases without adjectives or adverbs to specify 3 typical logic in structured programming: sequence, selection, and repetition
sequence: sequential order of the statements
selection: IF_THEN_ELSE; SELECT_CASE
repetition: DO_UNTIL; DO_WHILE
Cap & gown ordering systems example
Process 3.1
Validate Student Status
MATCH Student_Information with Student_Record using
student’s Last_Name and First_Name
BEGIN IF
IF
Student_Not_Found
THEN RETURN
Student_Not_Found
ELSE
IF
graduation_date is not equal to May, 2001
THEN RETURN Student_Invalid_Status
END_IF
RETURN Valid_Student
Process 3.2
Validate Order Item
MATCH Order_Item_Information with Available_Item_Record
based on Item_Description
BEGIN IF
IF the Order_Item_Quantity is grater than the
Available_Item_Quantity
THEN RETURN
Insufficient_Quantity
END_IF
RETURN Valid_Order
all possible choices and conditions the choices depend on are represented in tabular form: condition, actions, and rules
|
Conditions and
Actions |
Rules |
|
Conditions |
Condition alternatives |
|
Actions |
Action Entries |
Maximum number of rules in the table = ![]()
n: number of conditions
Ci: number of alternatives for condition i
|
Conditions and Actions |
Rules |
|||
|
1 |
2 |
3 |
4 |
|
|
Under $50 |
Y |
Y |
N |
N |
|
Pays by check with 2 forms of ID |
Y |
N |
Y |
N |
|
Uses credit card |
N |
Y |
N |
Y |
|
Ring up sales |
X |
|
|
|
|
Decline sales |
|
X |
|
|
|
Call supervisor for approval |
|
|
X |
|
|
Call bank for credit authorization |
|
|
|
X |
Cap & gown ordering
system example:
Process 3. Validate
Order
|
Conditions/Actions |
Rules |
|||
|
Student found |
Y |
- |
N |
- |
|
Graduate in May |
Y |
N |
- |
- |
|
Item in stock |
Y |
- |
- |
N |
|
Accept order |
X |
|
|
|
|
Reject order |
|
X |
X |
X |
Decision trees
(Figure 11.22)
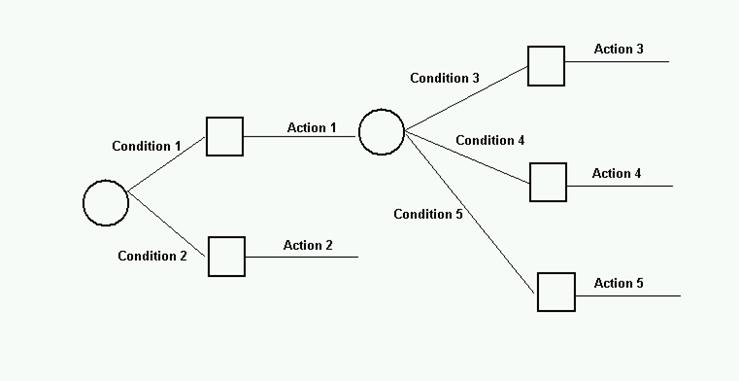
a decision or choice situation is depicted as a connected series of nodes
(decision points) and branches (decision alternatives)
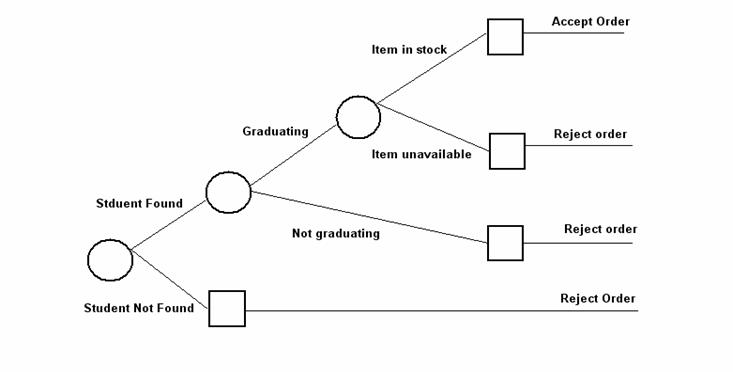
Cap & gown
ordering system example
When to use what?
|
Condition |
Recommendation |
|
Many repetitious actions |
Structured English |
|
Communication to end users is important |
Structured English |
|
Complex combinations of conditions, actions and rules |
Decision tables |
|
Checking for redundancies, contradictions, possibilities |
Decision tables |
|
The sequence of conditions and actions is critical |
Decision tree |
|
Not every condition is relevant to every action |
Decision tree |
Evolution of systems analysis
techniques
|
Era |
Orientation |
Techniques |
Evaluation |
|
Pre-computer |
Flow-oriented, i.e., no logical details |
· Process flow charts · Forms flow charts |
· Little clarification of system structure · Weak on the treatment of procedure |
|
1st Generation (1950's) |
Flow-oriented |
· System flow charts · Flowcharts · Message specification sheets |
· Reduce readability to non-technical people · Human is considered external to the system |
|
2nd & 3rd Generation (1970's) |
Package-approach |
· Decision tables · Gridcharts · Analysis packages, e.g., IBM's SOP (Study Organization Plan) |
· Multiple system representations require multiple tools |
|
4th Generation (1980's) |
Structured |
· Functional decomposition · IBM's HIPO · DFD · Data dictionary · Structured process specification |
· Improved consideration of system structure issues |
Findings
· A well structured implementation of a poorly designed system yield few benefits
· A well designed solution to a poorly understood problem provided few rewards
· No single tool, technique, or methodology can support the complete analysis of today's complex systems
· DFD is easier to learn and easier to use than functional decomposition.