The Fit_control dialog opens automatically with the Analysis_display window. Its main purpose is to allow the user to fit pre-defined curves to selected regions of an experimental trace. It can also be used to apply simple digitial filters to selected traces.
Batch_analysis tasks also use the Fit_control dialog to perform automated curve-fitting on sequences of data files.
The Fit_control dialog cannot itself be closed. It shuts down automatically when the Analysis_display window is closed.
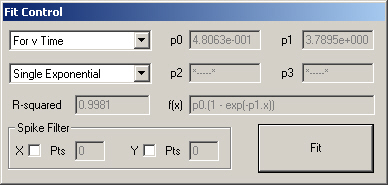
Filters and curve-fitting routines work on one data trace at a time and only on the section of the record between the two cursors. This pull-down menu lists all of the available plots. Select the plot you wish to analyze from the menu. The default is For v Time.
Back to Screenshot
Curve-fitting routines are provided for a number of different functions. Chose the desired one from the pull-down menu.
This portion of the display shows the parameter values (up to 4) calculated by the curve-fitting routines. The appropriate functional form is shown in the f(x) box. If a parameter value is not defined for a specific function (e.g. p(3) and p(4) by linear regression), *----* is displayed. If for some reason a curve-fit failed, the appropriate parameter values are marked with "Fit failed".
Back to Screenshot
This box shows the r2 value for a given fit calculated as follows
r2 = 1 - Σ(yi-y_fiti)2/ Σ(yi-mean_y)2
This obviously tends to 1 for 'good' fits but occasionally yields a negative value for incredibly bad fits (normally with a small number of data points). This is somewhat troubling but appears to follow from the method of estimating r2 rather than representing a 'bug' in the code.
Back to Screenshot
This section displays the functional form of the selected curve and associates individual p(i) values with selected fit parameters.
Back to Screenshot
Experimental records occasionally contain sharp (normally single point) 'glitches' which are probably caused by some sort of sporadic event or interference in the A/D conversion process. These do not normally affect the 'trend' of the data record but they can throw off curve-fitting routines. This part of the control allows the user to smooth out such glitches from the x and/or y values of the selected record. The filtering is very simple. Points which are more than 4 standard deviations from the local running average (calculated for 20 points on either side) are replaced by the mean value in the moving window. The numbers of points removed for each data set are shown in the appropriate controls. Filtering only occurs when the fit is calculated.
Back to Screenshot
Simply runs the fit for the selected portion of the selected plot and updates the displayed parameters. The original record is redrawn in yellow, the best-fit curve is drawn in magenta.
Back to Screenshot