USA, Louisiana - March 23rd, 2009 (Joe Omielan) - Project Update
Summary of summer 2008.
The design of the experiment has been modified to better “simulate” the effects of SBR and to measure the impact on Radiation Use Efficiency (RUE). This year only DP4331RR (Group IV) was planted in 38 inch rows. The plots were defoliated over the course of the season to reduce their Effective Leaf Area Index (ELAI) as a percentage of the control plots. These reductions over time “matched” what was found in our 2007 Brazil trial when SBR started at R1 and at R5 (see the graph below). The yield reductions in this experiment were compared to the Brazil trial.
Reductions in % of Control ELAI in plots when SBR started at R1 or R5. Data from 2006/2007 trial at Londrina, Brazil.
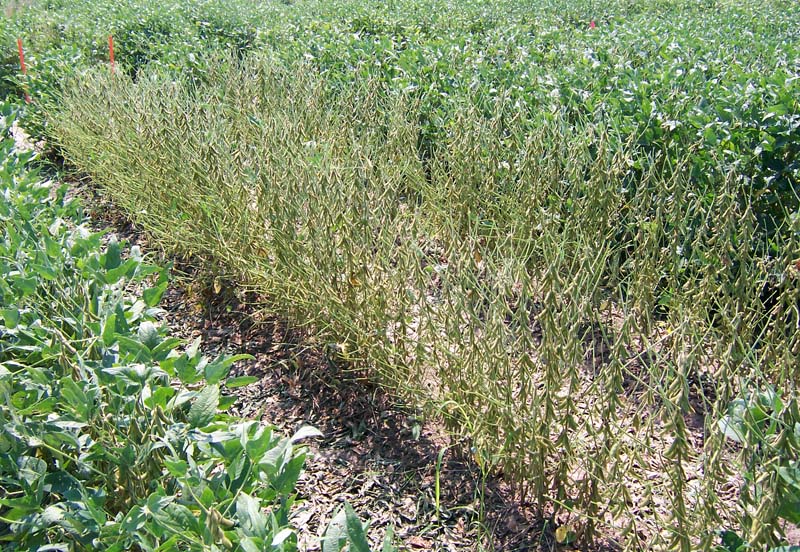
The photo above shows an example of one of the plots after 100% defoliation was reached.
Relationship between effective leaf area duration (ELAD) as % of control and % control yield for trials with SBR (Londrina, Brazil 2007) and simulating SBR damage (Baton Rouge, LA 2008). The linear regression for Brazil 2007 is plotted. The LSU yield reductions were similar to those from Brazil.
Stay Tuned for future updates!