|
|
Corn & Soybean News March,
2007, Volume 7, Issue 3 Printer-Friendly Version (pdf) Cooperating
Departments: Agricultural Economics, Biosystems and Agricultural Engineering,
Entomology, Plant and Soil Sciences, Plant Pathology Editor: |

|
ALS-Tolerant Johnsongrass in J. D. Green, W. W. Witt, Plant and Soil Science David Herbst,
 Johnsongrass (Sorghum
halepense L.) remains a common weed, ranking as the third most frequently
observed weed species within Johnsongrass (Sorghum
halepense L.) remains a common weed, ranking as the third most frequently
observed weed species within Fields in Question Poor
johnsongrass control was observed in two corn fields; one located in
Greenhouse study:
Johnsongrass seeds collected
from problem fields in |
· Two
johnsongrass populations are tolerating normal rates of ALS-inhibiting
herbicides. · ALS-inhibiting
herbicides include Accent, Beacon, Option and Lightning. · Relying
on the same mode of action increases the risk of resistance. |
||||||||||||||||||||||||||||||||||||||||||||||||||||||||||||||||||||||||||||||||||||||||||||||||||||||||||||||||
|
|
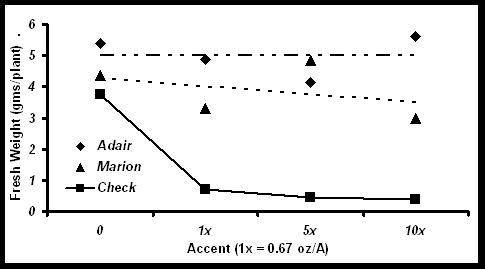
Figure 1. Johnsongrass response to
Accent (nicosulfuron) herbicide in greenhouse studies. Less fresh weight
means better control with Accent. |
|
|||||||||||||||||||||||||||||||||||||||||||||||||||||||||||||||||||||||||||||||||||||||||||||||||||||||||||||||
|
|
Field study:
Johnsongrass control at the
Adair field site was poor with all ALS-type herbicides (Figure 2). Little or no control of johnsongrass was
observed with Accent (nicosulfuron) and Option (foramsulfuron) at both the 1x
and 2x application rates and Beacon (primisulfuron) at the 1x rate. Beacon at the 2x rate and other
ALS-herbicides such as Steadfast (nicosulfuron + rimsulfuron) and Lightning
(imazethapyr + imazapyr) provided 35 to 45% visual control. The three non ALS-herbicides (Select, Assure II and Roundup)
provided good control (80% or more visual control of treated
johnsongrass). The exception was 68%
control with Assure II when applied at the 1x rate. Best results (90% control) were achieved
with the glyphosate (i.e. Roundup) treatment. |
|
|||||||||||||||||||||||||||||||||||||||||||||||||||||||||||||||||||||||||||||||||||||||||||||||||||||||||||||||
|
|
Figure 2. Field study in
|
|
|||||||||||||||||||||||||||||||||||||||||||||||||||||||||||||||||||||||||||||||||||||||||||||||||||||||||||||||
|
|
Johnsongrass Summary Our results
indicate that at least two johnsongrass populations in Since the effect
on succeeding generations have not yet been conducted to confirm resistance,
these findings are not fully conclusive that johnsongrass populations are
resistant to nicosulfuron (Accent) or other ALS-herbicides. However, we do know that these two populations
were not controlled by nicosulfuron in greenhouse evaluations nor in the
field in 2006. Clearly, these are
strong indications of resistance. Management of
this problem in corn will require planting corn hybrids which have tolerance
to glyphosate (eg. Roundup, Glyphomax, Touchdown, etc.). Management of this
problem in soybeans can include Assure II, Fusion, Select, or glyphosate
(i.e. Roundup Ready soybeans). Weed
management programs with non-ALS herbicides will be required for two to three
years to reduce johnsongrass populations in these fields. Crop producers
should always alternate herbicide chemistry to help prevent or minimize
future herbicide resistant problems. At this time we
do not know the full extent at which poor johnsongrass control is occurring
throughout More information about the findings from this study are
printed in WS 07-2 and are available at the Grain Crops Extension website:
http://www.uky.edu/Ag/GrainCrops/.
|
|
|||||||||||||||||||||||||||||||||||||||||||||||||||||||||||||||||||||||||||||||||||||||||||||||||||||||||||||||
|
Planting More Corn? Use Soil
Testing to Choose Your Fields Wisely Greg Schwab, Plant and
Soil Sciences Many Soil samples where forages were
the intended crop provide some insight into the expected fertilizer costs for
switching to corn. Approximately 22,500 soil samples where forages were the
intended crop were submitted to the UK Soil Testing Labs over the past three
years. Recommendations from those soil
test results were recalculated assuming corn would be the new intended crop.
Fertilizer prices of $0.22/lb P2O5, $0.22/lb K2O,
$1.20/lb Zn, and $12/ton lime were used to calculate fertilizer cost
(nitrogen cost is not factored into this analysis). Results show that the cost
ranged from $0 to $146/acre, with an average of $22 to $45/acre depending on
the region. The By soil testing early this spring, corn producers can identify fields that have a relatively low need for additional fertilization, thus minimizing input costs. In fact, if fields are chosen correctly, corn following forages could be significantly cheaper than corn following grain crops because of the lower N requirements. Alternatively, if corn is going to be grown on some of these very poor testing soils, then farmers must realize that a significant investment in fertilizer is needed to avoid yield limiting soil pH or nutrient deficiencies.
|
· If
switching from forages to corn, then check soil fertility levels. · Fertilizer
requirements could cost $50/acre. |
||||||||||||||||||||||||||||||||||||||||||||||||||||||||||||||||||||||||||||||||||||||||||||||||||||||||||||||||
|
|
|
||||||||||||||||||||||||||||||||||||||||||||||||||||||||||||||||||||||||||||||||||||||||||||||||||||||||||||||||
|
Better Soil as Important as Fertilizer N When Growing Corn After
Grass/Legume Forages John H. Grove, Plant and Soil Sciences High
corn prices are causing cattle producers to consider growing more of their
feed grain needs in their pasture and hay fields. In Yield
response to fertilizer N was determined for corn in each crop rotation.
Maximum fertilizer N rates were determined at the point where no further
yield response to fertilizer N occurred. On a Maury silt loam in 2004 and
2005, fertilizer N rates for corn after a grain crop were within range of the
|
· Corn
after forages: reduce N rates by 25 to 50 lbs/acre · Poor
soils with low yield potential: N rates above 40 lb/acre, less likely to make
a profit. |
||||||||||||||||||||||||||||||||||||||||||||||||||||||||||||||||||||||||||||||||||||||||||||||||||||||||||||||||
|
|
 |
||||||||||||||||||||||||||||||||||||||||||||||||||||||||||||||||||||||||||||||||||||||||||||||||||||||||||||||||
|
|
The
data in Figure 1, for only two years, was combined with earlier data, from
the mid-1990’s, to give 5 years of N response information for corn after corn
or corn after grass/clover hay (Table 1). The corn after grass/clover hay
data were separated by soil. The better soil area, which provides more plant
available water to the crop, was a mixture of deep Maury and Huntington
series, while the poorer soil area was a mixture of McAfee and shallow Maury
soils. Table
1 gives the average corn yield response to fertilizer N, the average
increment in corn yield with each additional 40 lb N/acre, and the increment
ratio (bu/lb N). If fertilizer N is worth $0.45/lb, and corn is $3.75/bu,
then the increment ratio must be greater than 0.12 bu/lb N for that increment
of 40 lb N/acre to be profitable. When corn was grown after corn, fertilizer
N was usually profitable (4 out of 5 years) up to 120 lb N/acre. The
profitability of 160 or 200 lb N/acre was a coin toss (50%). Corn after
grass/clover hay was usually responsive (3 out of 5 years) to 40 lb N/acre,
regardless of soil quality. The better quality soil, with greater plant
available water holding capacity, exhibited greater yield potential (+19
bu/acre), and responded profitably more often (3 out of 5 years) to 80 lb
N/acre. Fertilizer N rates above 80 lb N/acre were unprofitable more often
than not. Clearly,
corn following grass/legume forage needed less fertilizer N to reach maximum
yield potential. But maximum yield potential depended strongly on the soil
selected for no-till corn production. |
|
|||||||||||||||||||||||||||||||||||||||||||||||||||||||||||||||||||||||||||||||||||||||||||||||||||||||||||||||
|
|
|
||||||||||||||||||||||||||||||||||||||||||||||||||||||||||||||||||||||||||||||||||||||||||||||||||||||||||||||||
|
|
|
|
|||||||||||||||||||||||||||||||||||||||||||||||||||||||||||||||||||||||||||||||||||||||||||||||||||||||||||||||
|
Seed Concerns: You Can’t Always Get What you Want Tom Miller, Seed
companies and farmers face a time when there are a whole lot of options for
hybrids and, at the same time, very few options. Farmers may not be able to
get the hybrid(s) they want for 2007. This challenge may be with us for
several years. Unlike
a chemical that can be manufactured quickly, hybrid corn seed has to be grown
the season before. So the seed companies are always guessing a year or two
ahead to produce the hybrids they think you want. The method has become
extremely difficult as companies try to identify the right combination of
biotech traits with a set of base genetics that has yield potential and
possibly other defensive traits. As a
producer, you may be interested in Hybrid “A”. You may want the conventional,
no-traits-added version of Hybrid “A”. Or you can get that hybrid in Roundup
Ready, Liberty Link, Bt corn borer (which also may be Liberty Link) and Bt
corn rootworm (which also may be Liberty Link), or just about any combination
of these traits. This is just one example of where you could get as many as
ten different options on that base genetics. Once
you have decided which option you want, then you have to decide if you want
insecticide seed treatment and at what dose. In addition, you may want rounds
or flats, depending on your planter configuration. Now, you have a base
genetics that may have up to 20 variations when upon delivery this spring. The
seed companies may have 10 different base genetics that fit your growing
area. With another 10 trait options for each set of base genetics, the seed
company has to forecast farmer demand in about 100 different hybrids for your
growing area. As new traits are added to the toolbox, the options get even
larger. Any
seed company can probably do a great job of forecasting demand for 10 hybrids
within a particular growing region. A company has a much more difficult time
forecasting 100 options. As a result, seed companies may decide to ‘stack’
traits, thus reducing the number of options they offer and simplifying the
task of forecasting market demand. Some companies provide some hybrids with a
seed treatment, whether you want it or not. You
may only want to purchase a Roundup Ready hybrid. But the genetics you want
is in a Roundup Ready-Bt corn borer stack. You end up paying for technology
you don’t want. Add
to all of this the prediction that corn production in the A
company could capture tremendous market share if its scientists figure out how
to put all the traits into one hybrid and then turn off the trait(s) you
don’t want to pay for. We are at least several years away from this scenario.
For
2007, you will have to buy what is available, not what you want. For 2008,
the best bet is to use university and county trials to identify several
hybrids with proven performance records. Try to book that seed in November
(although the companies would prefer an even earlier booking). Now you have a
contingency plan in place if your first choice is not available. |
· The biotech traits create many more options. · The options are not always packaged the way you would
prefer. · For 2007, it’s too late; Plan early for 2008. |
||||||||||||||||||||||||||||||||||||||||||||||||||||||||||||||||||||||||||||||||||||||||||||||||||||||||||||||||
|
Winter 2006/2007 in Tom Priddy, Biosystems and Agricultural
Engineering
What's next for
Here's the
official National Weather Service outlook: For more
information on Kentucky Weather go to the Kentucky Ag Weather Center: http://wwwagwx.ca.uky.edu/ |
· Warm
and cold define the past three months. · Rainfall
should be near normal this spring. |
||||||||||||||||||||||||||||||||||||||||||||||||||||||||||||||||||||||||||||||||||||||||||||||||||||||||||||||||

|
|
|
|
|
Chad D. Lee, Grain Crops Extension Specialist 423 Plant Sciences Building |