
December 2008, Volume 8, Issue 3
Cooperating Departments: Agricultural Economics, Biosystems and Agricultural Engineering, Entomology, Plant and Soil Sciences, Plant Pathology
Editor:

In this issue
5. Choosing Fields for Grid Sampling
uk > ag > pss > grain crops extension > corn & soy news
|
December 2008, Volume 8, Issue 3 Cooperating Departments: Agricultural Economics, Biosystems and Agricultural Engineering, Entomology, Plant and Soil Sciences, Plant Pathology Editor:
|
||
|
In this issue 5. Choosing Fields for Grid Sampling |
||
1. Reducing Fertilizer Rates While Maintaining Yields
Lloyd
Murdock, Extension Soil Specialist, University of Kentucky
The prices
of fertilizer inputs have increased at an astounding rate the last two years. With
the decrease in commodity prices, fertilizer inputs cost may now be the
dominate factor in determining a profit. Efficient and wise use of fertilizers
and the nutrients in the soil become important in determining the crop grown as
well as its profit.
Below are
listed points one should consider to make the fertilizer purchased and the
nutrients in the soil profitable for you.
A.
Soil Testing. Probably the most important step. If
there was ever a year to use the reserves of P and K in the soil – this is
it! To do this, a good soil test should
be taken.
a.
Make sure a large number of samples are taken
from each field.
b.
Do not sample a field or area of a
field larger than 20 acres, especially if the different areas in the field vary
a lot in yield or have been managed differently in the past (crops, manures,
etc.)
c.
Use grid sampling if you are
unfamiliar with the field’s past history.
d.
If you are mainly no-till, use a
4-inch deep soil sample.
B.
Use the Fertility in Your Soil – If you soil test P is 45 lbs/ac or
greater and soil test K is 250 lb/ac greater, no additional fertilizer is
required for that crop that year. You already have enough in the soil to take
care of it. Why add fertilizer just to increase your expense?
If
the soil test P is between 30 and 45 or the soil test K is between 200 and 250,
use only a maintenance amount of P and K fertilizers. That is sufficient for
maximum yields.
If
you are in the low range for P & K (below 30 and 200), add the UK
recommended rate of fertilizer or use row fertilizer to reduce the amount
needed.
C.
Row Fertilizers – When you are in the low range of P
or K soil test, the fertilizer can be banded beside the row and improve the
efficiency of use. Fertilizer rates can be reduced by 1/3 to ½ of that
recommended for broadcast treatments.
D.
Maintain a Proper pH – The best pH for most crops is
between 6.2 and 7.0. When in this range, fertilizers are used more efficiently.
Phosphorus can be as much as 20-25% more available in this pH range as opposed
to a pH in the 5’s.
E.
Manures are an excellent source of fertilizers and are usually much
cheaper than purchased commercial fertilizers. Good distribution and nutrient
testing are the keys to the use of manures as fertilizers. They will usually
build P levels and maintain K levels when used. The N availability is somewhat
unpredictable but good estimates can be made for the conditions under which the
manure was used.
F.
K fertilizer timing is important on crops when the
vegetation is the harvested crop such as silage, hay or straw. The plant will
take up more K than is needed for production if it is available for uptake. This
is called luxury consumption. If vegetation is going to be removed, then K
fertilizer should be applied before each crop. For example, if wheat straw is
to be harvested, then K fertilizer should be applied before wheat and again
before double crop soybeans. If growing alfalfa, K should be applied after the
1st harvest and again after the 3rd harvest.
G. Nitrogen rates for grain cannot be changed with the present economics. However, sidedressing some of the N on poorly or somewhat poorly drained soils will improve nitrogen efficiency and rates can be reduced by 35 lbs/ac from preplant recommendations.
2.
“Risk Scale”, When Fungicide Use on Grain Crops Might Pay
Paul
Vincelli and Don Hershman, Extension Plant Pathologists, University of Kentucky
During
recent years, interest in the use of fungicides on corn and soybeans has grown
dramatically. This interest has been especially high during growing seasons
with high grain prices. With falling grain prices and increasing input costs,
producers are increasingly interested in deciding how to best use fungicides—or
whether to use them at all—on their grain crops.
Grain
producers understand well the fact that they deal with risks and probabilities
throughout the production and marketing of their crop. For example, weather
reports issue forecasts of precipitation probabilities. Another example: a
producer who sows corn in a field that normally averages 150 bushels per acre
knows there is a low probability that the current crop will yield 270 bushels
per acre. Risk is inherent to crop production, and nothing about it is
certain—probabilities underlie every aspect of crop production.
This
principle applies to fungicide use in grains, as well. It doesn’t make sense to ask, “Will the
fungicide Blightban (a fictitious
name) increase my profit
margin?” It only makes sense to ask,
“How likely is it that Blightban will increase my profit margin?”
So we’ve framed the correct question: “How likely is it that Blightban will increase my profit margin”? Wouldn’t it be nice to know a precise answer to this question, just like a precipitation probability? For example, wouldn’t it be nice to know that Blightban had a 70% chance of increasing your profit margin in Field A, a 30% chance in Field B, and a 10% chance in Field C? It would be wonderful, of course. The problem is, no one can tell you this with even a smidgeon of accuracy (at least not yet).
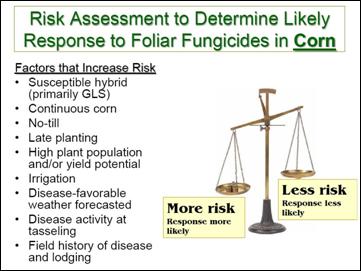
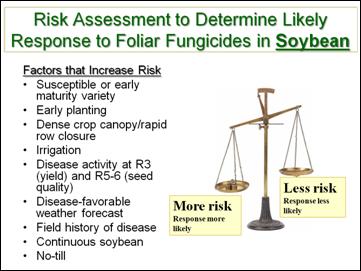
But what you can do, as grain crop producers, is identify the factors that increase the probability of getting a profit from a fungicide application. That is what the three accompanying figures do, one each for corn, soybeans, and wheat. In these figures, we list the factors that increase the risk of disease, listing the more important one toward the top of the figure. The more of these are in place in a given field, the higher the probability that a fungicide will give an increased profit (i.e., economical yield response). Conversely, the fewer of these that are in place, the higher the probability that you will lose money by applying a fungicide.
Our focus is on factors that increase the risk of key diseases that are controlled by foliar fungicides, such as gray leaf spot of corn, frogeye leaf spot of soybean or speckled leaf blotch of wheat. However, factors that increase the risk of viruses, stalk rots, root rots, nematode diseases, and other diseases not controlled by foliar fungicides are not factored into these risk scales. These other diseases may negate any benefit from using foliar fungicides even if every decision leading up to a fungicide application, and the application itself, was made perfectly. This, again, highlights the uncertainty inherent in crop production.
Bottom Line: During 2009, see how many of the factors listed in Figure 1 apply to each of your fields. The more of these factors you have in a field, the better chance you have of making a profit with a fungicide application.
Figure 1. Factors that increase risk of foliar disease to corn and soybean.
 |
 |
3. The Kentucky
Soybean Performance Test Puts Money in Your Pocket
Roger
Rhodes, D.B. Egli and Chad Lee, Plant and Soil Sciences, University of Kentucky
Would
you like to increase your soybean yields by several bushels per acre without
spending any money? All it may take is a hard look at the results of the
Kentucky Soybean Performance Test. A recent investigation suggests that
Kentucky soybean producers are losing money by not always using the best
varieties.
According
to a 2007 survey published in Kentucky Agricultural Statistics (2006-2007), the
most popular soybean variety in the state was a relatively poor yielder in the
Kentucky, Tennessee and Missouri 2007 Soybean Performance Tests. This variety
was grown on 92,000 acres in Kentucky in 2007 (8% of the 1.15 million acres
planted), but its three-year average yield was 5.4 bushels less that the
average of the three highest yielding varieties with similar maturities (Table
1). Farmers using this variety lost nearly $50 per acre, assuming $9.00 beans,
which would just about cover the cost of seed in 2009.
The
picture was a little better if we look at the top five varieties in the survey
– two were equal to the best and the other two were only 2 to 3 bushels below
the best (Table 1). Five of the top nine varieties in 2007 were equal to the
best varieties in the test. Many Kentucky producers are doing a good job of
picking varieties, but there is room for improvement.
Data
from county and industry yield trials, demonstration plots and the Kentucky
Soybean Performance Test are available to help you select the best variety. The
University of Kentucky variety testing program measures yield at five locations
each year and many varieties are in the test for two or three years. Yields are
published every fall in the Kentucky Soybean Performance Test Bulletin
available online at http://www.uky.edu/Ag/GrainCrops/varietytesting.htm or at your county Extension office.
The
best predictor of next year’s performance is the average yield across all
locations and years in the bulletin. The top yielding varieties in 2008 from
relative maturity group 4.6 to 4.9 are shown in Table 2. Varieties that rank at
the top of the test for the one-, two- and three-year comparisons are most
likely to perform well next year. Planting a sub-par variety leaves dollars in
the field instead of in your pocket.
When
asked why he robbed banks, Willie Sutton replied, “Because that’s where the
money is.” Paraphrasing Willie -- look in the variety test bulletin, that’s
where the money is. You can get your hands on that money by spending some time
studying the performance test results and selecting top-yielding varieties.
Table
1. Performance of the five most popular soybean
varieties in
These five varieties were planted on 316,000
acres (27.5 % of the planted acres) in 2007.
Variety1
|
Rank
|
Percent
of planted acreage
|
2005-2007
Yield2
|
Advantage
for ‘best’ varieties3
|
Loss
for not using best variety4
|
|
|
|
%
|
Bu/acre
|
Bu/acre
|
$/acre
|
|
Pioneer 94M80
|
1
|
8.0
|
48.8
|
5.4
|
48.60
|
|
NK S49-Q9
|
2
|
6.6
|
51.5
|
2.8
|
25.20
|
|
Asgrow AG4703
|
3
|
4.9
|
53.4
|
0.0 5
|
0.00
|
|
Pioneer 94B73
|
4
|
4.1
|
53.4
|
0.0
|
0.00
|
|
Pioneer 94M30
|
5
|
3.0
|
52.3
|
2.1
|
18.90
|
|
1 Data from 2007 variety survey, Kentucky Agricultural Statistics
and Annual Report, 2006-2007. p. 55.
|
||||||
2 Three year average across locations.
|
||||||
3 Average of the top three varieties in the same maturity group,
three year, all location mean.
|
||||||
4 Assuming a price of $9.00/bushel.
|
||||||
5 Yield was not significantly different from top-yielding variety
in the test.
|
||||||
Table
2. The top-yielding soybean varieties in the
Relative Maturity Group 4.6 to 4.9 in the 2008 Kentucky Soybean Performance
Test.
|
|
|
YIELD (BU/AC)A
|
LODGING
|
||||
TYPE
|
BRAND -- VARIETY
|
2008
|
|
07-08
|
|
06-08
|
2008
|
|
|
|
|
|
|
|
|
|
|
|
|
MATURITY GROUP LATE IV (RELATIVE MG
4.6-4.9)
|
|
|
|
|
|
|
|
|
|
|
|
|
|
|
|
|
*
|
PIONEER
94Y70
|
46.6
|
|
|
|
|
1.7
|
|
*
|
ASGROW
DKB46-51
|
46.5
|
|
42.2
|
|
47.3
|
1.4
|
|
*
|
ASGROW
AG4606
|
46.5
|
|
|
|
|
1.4
|
|
*
|
PROGENY
P4908 RR
|
46.3
|
|
|
|
|
1.5
|
|
*
|
ARMOR
48-J3
|
46.1
|
|
45.1
|
|
|
1.4
|
|
*
|
DELTA
GROW 4970 RR
|
45.9
|
|
40.6
|
|
47.2
|
1.9
|
|
*
|
BECK
474NRR
|
45.7
|
|
|
|
|
1.3
|
|
|
ASGROW
AG4903
|
45.5
|
|
42.5
|
|
48.0
|
1.4
|
|
*
|
UNISOUTH
GENETICS USG 74A76
|
45.4
|
|
42.7
|
|
48.0
|
1.6
|
|
*
|
VIGORO
V47N9RS
|
45.3
|
|
|
|
|
1.3
|
|
*
|
CROW'S
C4820R
|
45.0
|
|
|
|
|
1.3
|
|
|
DELTA
GROW 4870 RR
|
45.0
|
|
|
|
|
1.5
|
|
*
|
SEED
CONSULTANTS SCS 9479RR
|
45.0
|
|
|
|
|
1.4
|
|
*
|
UNISOUTH
GENETICS USG 74G78
|
45.0
|
|
|
|
|
1.1
|
EXP
|
*
|
NK
BRAND XR4881
|
44.8
|
|
|
|
|
1.2
|
|
*
|
SOUTHERN
CROSS RUFUS 4.7 N, RR, STS
|
44.6
|
|
|
|
|
1.2
|
|
*
|
PROGENY
P4606 RR
|
44.4
|
|
43.3
|
|
|
1.2
|
|
*
|
SOUTHERN
STATES RT 4808N
|
44.4
|
|
43.9
|
|
49.2
|
1.6
|
|
|
DAIRYLAND
8482/RR
|
44.4
|
|
42.0
|
|
|
1.5
|
|
*
|
SOUTHERN
STATES RT 4888N
|
44.2
|
|
|
|
|
1.4
|
|
*
|
PROGENY
P4918 RR
|
44.2
|
|
|
|
|
1.6
|
|
|
LATE GROUP IV AVERAGE
|
42.8
|
|
40.8
|
|
47.2
|
1.4
|
|
|
LSD (0.10)
|
2.2
|
|
3.8
|
|
2.5
|
0.1
|
* Resistant to soybean cyst nematode.
A Within a maturity group, shaded yields are
not significantly different (0.10 level) from the highest yielding cultivar
(bold data) of that maturity group and year column.
EXP. Entries with an EXP prefix are varieties
that are still under development or soon to be released.
4. Soybean Seed Rates for 2009
Chad Lee and Jim Herbek, University of Kentucky
A final stand of about 100,000 plants per acre in full season soybeans is sufficient for maximum yield.
One obvious question is, how many seeds to I need to plant to get a
final stand of 100,000 plants per acre? The answer…it depends!!
The correct seeding
rate depends on seed germination and how many seedlings do not emerge from the
soil, i.e. the expected stand loss for each field. Below is Table 1 to help make
those decisions. For example, if your target population is 100,000 plants per
acre and your seed germination is 95%, then you would need 105,263 seeds per
acre. If you are planting in excellent conditions, then you might assume a minimal stand loss of 5%.
So, you would need to plant 110,803 seeds per acre to get a target stand of 100,000 plants per acre.
If, your seed germination rate is the same (95%), but you are planting into poor conditions, you might assume a 30% stand loss and then plant 150,376 seeds per acre.
Your challenge is
to determine what kind of stand loss you expect in your fields. If you are
planting into fields that have a history of crusting or a history of staying
wet in the spring or planting into cool soil conditions, you may want to assume
a higher stand loss. If you are planting into fields that have a history of
good emergence, you may want to assume a much lower stand loss.
Determining the seeding rates you will use can impact your input dollars. If projected prices
for 2009 soybeans are accurate, then you could easily spend $70 per acre in
seed. Two tables below provide some simple cost estimates based on a 50-lb bag
of seed including two different seed sizes (Table 2) or based on bags with a
specified number of seeds (Table 3).
Hopefully, these tables can help sharpen your pencils for 2009. If you have more questions about
seeding rates or seed costs, contact your county extension office.
Table 1. Soybean Seeding Rate Calculations |
||||||||
Seeding rate should be based on germination rate as well as expected stand losses. Stand losses are typically more severe in damp, cool conditions with heavy residue or with soil crusting. Stand losses are typically less with warm conditions and adequate soil moisture. |
||||||||
Full Season Soybeans |
||||||||
Target Stand |
Seed Germ. |
Initial Seeding Rate |
Assumed Stand Loss |
Final Seeding Rate |
Row Spacing (inches) |
|||
7.5 |
15 |
30 |
||||||
plants/acre |
|
seeds/acre |
|
seeds/acre |
Seeds per foot |
|||
100,000 |
85% |
117,647
|
5%
|
123,839
|
1.8
|
3.6
|
7.1
|
|
100,000
|
90%
|
111,111
|
5%
|
116,959
|
1.7
|
3.4
|
6.7
|
|
100,000
|
95%
|
105,263
|
5%
|
110,803
|
1.6
|
3.2
|
6.4
|
|
100,000
|
85%
|
117,647
|
10%
|
130,719
|
1.9
|
3.8
|
7.5
|
|
100,000
|
90%
|
111,111
|
10%
|
123,457
|
1.8
|
3.5
|
7.1
|
|
100,000
|
95%
|
105,263
|
10%
|
116,959
|
1.7
|
3.4
|
6.7
|
|
100,000
|
85%
|
117,647
|
20%
|
147,059
|
2.1
|
4.2
|
8.4
|
|
100,000
|
90%
|
111,111
|
20%
|
138,889
|
2.0
|
4.0
|
8.0
|
|
100,000
|
95%
|
105,263
|
20%
|
131,579
|
1.9
|
3.8
|
7.6
|
|
100,000
|
85%
|
117,647
|
30%
|
168,067
|
2.4
|
4.8
|
9.6
|
|
100,000
|
90%
|
111,111
|
30%
|
158,730
|
2.3
|
4.6
|
9.1
|
|
100,000
|
95%
|
105,263
|
30%
|
150,376
|
2.2
|
4.3
|
8.6
|
|
Table 2. Soybean Seed Costs for a 50-pound bag.
|
|||||||||||
Costs for a 50 lb bag (not adjusted to a specific seed number).
|
|||||||||||
Seed
Cost
|
Seed
Size
|
Seed
Rate
|
Seed
Cost
|
Seed
Cost
|
Seed
Size
|
Seed
Rate
|
Seed
Cost
|
||||
$/50-lb bag
|
seeds/lb
|
seed/acre
|
lb/acre
|
bags/acre
|
$/acre
|
$/50-lb bag
|
seeds/lb
|
seed/acre
|
lb/acre
|
bags/acre
|
$/acre
|
50.00
|
2800
|
120,000
|
43
|
0.86
|
42.86
|
50.00
|
3200
|
120,000
|
38
|
0.75
|
37.50
|
50.00
|
2800
|
160,000
|
57
|
1.14
|
57.14
|
50.00
|
3200
|
160,000
|
50
|
1.00
|
50.00
|
50.00
|
2800
|
200,000
|
71
|
1.43
|
71.43
|
50.00
|
3200
|
200,000
|
63
|
1.25
|
62.50
|
40.00
|
2800
|
120,000
|
43
|
0.86
|
34.29
|
40.00
|
3200
|
120,000
|
38
|
0.75
|
30.00
|
40.00
|
2800
|
160,000
|
57
|
1.14
|
45.71
|
40.00
|
3200
|
160,000
|
50
|
1.00
|
40.00
|
40.00
|
2800
|
200,000
|
71
|
1.43
|
57.14
|
40.00
|
3200
|
200,000
|
63
|
1.25
|
50.00
|
30.00
|
2800
|
120,000
|
43
|
0.86
|
25.71
|
30.00
|
3200
|
120,000
|
38
|
0.75
|
22.50
|
30.00
|
2800
|
160,000
|
57
|
1.14
|
34.29
|
30.00
|
3200
|
160,000
|
50
|
1.00
|
30.00
|
30.00
|
2800
|
200,000
|
71
|
1.43
|
42.86
|
30.00
|
3200
|
200,000
|
63
|
1.25
|
37.50
|
* calculation: $/acre = ($ per bag/(seed size x 50 lb))x
seedrate
|
|||||||||||
Table 3. Soybean seed costs for bags sold with a specified seed
number.
|
||||||
A) Costs for a 140,000 unit bag.
|
B) Costs for a 130,000 unit bag.
|
|||||
Seed
Cost
|
Seed
Rate
|
Seed
Cost
|
Seed
Cost
|
Seed
Rate
|
Seed
Cost
|
|
$/140K bag
|
seed/acre
|
$/acre
|
$/130K bag
|
seed/acre
|
$/acre
|
|
$ 50.00
|
120,000
|
$ 42.86
|
$ 50.00
|
120,000
|
$ 46.15
|
|
$ 50.00
|
160,000
|
$ 57.14
|
$ 50.00
|
160,000
|
$ 61.54
|
|
$ 50.00
|
200,000
|
$ 71.43
|
$ 50.00
|
200,000
|
$ 76.92
|
|
$ 40.00
|
120,000
|
$ 34.29
|
$ 40.00
|
120,000
|
$ 36.92
|
|
$ 40.00
|
160,000
|
$ 45.71
|
$ 40.00
|
160,000
|
$ 49.23
|
|
$ 40.00
|
200,000
|
$ 57.14
|
$ 40.00
|
200,000
|
$ 61.54
|
|
$ 30.00
|
120,000
|
$ 25.71
|
$ 30.00
|
120,000
|
$ 27.69
|
|
$ 30.00
|
160,000
|
$ 34.29
|
$ 30.00
|
160,000
|
$ 36.92
|
|
$ 30.00
|
200,000
|
$ 42.86
|
$ 30.00
|
200,000
|
$ 46.15
|
|
5.
Choosing Fields for Grid Sampling/Precision Nutrient Management
John H. Grove and Greg J. Schwab, Plant and
Soil Sciences, University of Kentucky
Precision nutrient management is grid
sampling followed by variable rate application and it can allocate lime and
fertilizer phosphorus (P) and potassium (K), within the field. Field areas with
greater or fertility receive less while areas with or lower fertility receive
more. Precision nutrient management can reduce input costs when identifying
more fertile areas, while optimizing the probability of an economic response to
lime and fertilizer by identifying less fertile field areas. However, precision
nutrient management has greater costs – up to $5/acre extra for grid sampling
and $5/acre extra for each variable rate application (liming would be separate
from P and K application).
So, when is it likely that the value of
precision nutrient management is greater than the cost? What should do you look
for? What are the “signals” that a field is a candidate for precision nutrient
management? The soil test data from 46 grid-sampled fields, ranging in size
from 35 to 140 acres, and totaling 2500 acres were examined in order to answer
these questions. The soil pH, soil test P (STP) and soil test K (STK) were used
to generate lime and fertilizer P and K recommendations, respectively, for the
following year’s corn crop from AGR-1 (2008-2009 Lime and Nutrient
Recommendations).
The amount of ‘redistributed’ lime and
fertilizer P and K that would result from precision nutrient management was
calculated. ‘Redistributed’ refers to both the lime and fertilizer not applied
to more fertile field areas, as well as the additional lime and fertilizer
applied to less fertile field areas. This was done for each field and expressed
as ton lime/acre, lb P2O5/acre and lb K2O/acre.
In these 46 fields, the quantity of
redistributed input was highest when the field-average soil test value was
close to the threshold that triggered the first increment of lime or fertilizer
P or K. Figures 1 and 2 illustrate these relationships for lime and fertilizer
K, respectively. A lime recommendation for corn is triggered when the soil pH
falls to 6.1, while fertilizer P and K recommendations (corn for grain) are
triggered when STP and STK decline to 60 and 300, respectively.
Though the field-average soil test status was
the best predictor of a probable benefit from precision nutrient management,
the next-best indicator was the variability of a given soil test parameter
within a field. This is illustrated, using STK as an example, in Figure 3.
Generally, as the variation in STK rises, the amount of fertilizer K
redistributed via precision management also rises.
So, with corn for grain, precision soil
sampling is most justified when the soil pH is between 5.8 and 6.4, when
Mehlich III STP is between 40 and 80, and/or when Mehlich III STK is between
240 and 360. This is especially true if
there is significant variability in that soil test parameter within the field.
However, knowing what to look for is not the same as knowing how to find it.
First, look at a field’s soil test history.
Field’s with values for two out of three (pH, STP or STK) soil test parameters
approaching lime or fertilizer P or K ‘triggers’ are likely grid sampling candidates.
Fields without soil test history can be pre-sampled, taking 3 to 5 samples from
distinct field areas, and having these analyzed separately in order to generate
both average and variability information.
Figure 1. Lime redistribution
with precision nutrient management as related to the field-average soil pH
level in the 46 grid-sampled fields. ‘Redistributed’ refers to both the lime
and fertilizer not applied to more fertile field areas, as well as the
additional lime and fertilizer applied to less fertile field areas.
Figure 2. Fertilizer K
redistribution with precision nutrient management as related to the
field-average soil test K (STK) level in the 46 grid-sampled fields. ‘Redistributed’ refers to both the lime and
fertilizer not applied to more fertile field areas, as well as the additional
lime and fertilizer applied to less fertile field areas.
Figure
3. Fertilizer K redistribution with precision nutrient management as related to
the field’s variability in soil test K (STK). ‘Redistributed’ refers to both
the lime and fertilizer not applied to more fertile field areas, as well as the
additional lime and fertilizer applied to less fertile field areas.
An Equal Opportunity University,
University of Kentucky, College of Agriculture, Kentucky Cooperative Extension · Copyright © 2008