

Corn & Soybean News
April 2009, Volume 9, Issue 3
Corn and Soy Newsletter Home
Grain Crops Extension Home
Cooperating Departments: Agricultural Economics, Biosystems and Agricultural Engineering,
Entomology, Plant Pathology , and Plant and Soil Sciences
Editor: Chad Lee
In this issue
1. Gypsum
2. Enough Insect Control
3. Corn Seed Rates
4. Soybean Seed Rates
5. ACRE Online Calculator
6. Paperless
printer-friendly pdf (Note: this html site is also printer-friendly)
1. By-Product Gypsum: What's it Worth to the Corn and Soybean Producer?
John Grove, Soils Science Research
Department of Plant and Soil Sciences, University of Kentucky
The short answer is, not much. Gypsum, also called calcium sulfate (CaSO4.2H2O), is a source of plant available calcium (Ca) and sulfur (S), being 23.3% Ca and 18.6% S in the pure compound, if you need these nutrients. A yield response to greater Ca or S nutrition has never been observed on a Kentucky corn or soybean crop.
By-product gypsum is produced, in large amounts, by S removal during electricity generation, oil refining and phosphate fertilizer manufacturing; and during waste water treatment. The major industrial use of by-product gypsum was wallboard manufacture, but the housing construction slowdown has left industry with mountains of by-product, mountains that need to go somewhere.
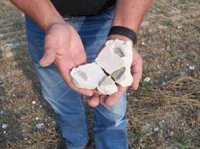
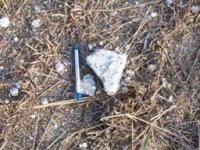
The physical consistency of these materials varies. Some are dry, fine and dusty, while others are moist, caked and lumpy (Image 1). Few are "field-ready" for optimal spreading behavior (Image 2).
|
|
Image 1. Gypsum clumps. |
Image 2. Gypsum clump next to a writing pen. |
The chemical consistency of by-product gypsums also varies because of other chemicals trapped during the industrial processes that generate them. These contaminants may include nutrients (magnesium, potassium, phosphorus, boron, copper, iron, manganese, molybdenum, and zinc) other than Ca and S, as well as other elements (aluminum, arsenic, selenium, silicon, sodium, nickel, chromium, mercury, etc.) of biological concern. These are not consistently present in all by-product gypsums, or may be at such low levels as to be innocuous. Some nutrient elements (boron, copper, molybdenum and zinc) become toxic at high concentrations. Not all elements found in such materials are immediately bioavailable, either. Still, no agricultural user of by-product gypsum should proceed without a "chemical analysis profile" of the material. The chemical analysis should also determine whether the material contains unreacted alkalinity (liming value) or strong salinity (other sulfate and/or chloride salts).
In Kentucky, S deficiencies have not been observed, and UK extension personnel are always on the lookout for them. Sulfur deficiencies in corn and soybean are best confirmed by plant analysis. Soil sampling for plant available S requires a subsoil sample, because considerable sulfate may be held there. If needed, S should be added at a rate of 20 to 40 lb S/acre, requiring 120 to 240 lb gypsum/acre.
Kentucky soils contain large amounts of bioavailable Ca, and a corn or soybean Ca deficiency has not been seen here. There have been reports, from the southeastern United States, Brazil and South Africa, that a high rate of gypsum (at least 1000 lb/acre) would reduce subsoil acidity, improve crop root development, increase subsoil water use, and raise crop yield. Some Kentucky soils have acid subsoils that might benefit from this practice, but little research has been done and no recommendation can be made.
Gypsum application has been reported to improve soil physical properties, including structure and water infiltration, while reducing crusting. These benefits are associated with gypsum use on saline-sodic and sodic soils, found in the more arid parts of the western United States, which do not occur in Kentucky. The positive benefit of organic matter to Kentucky's soil physical properties is well known, but a response of one of these properties to gypsum application, of any kind, has never been shown here.
Overall, the expected benefits of by-product gypsum applications are few. However, it is also true that these materials, if they do not contain hazardous contaminants, are not harmful to agricultural soils. This suggests that corn/soybean producers should, if they apply the material at all, be paid to use it. By-product gypsum that is applied to agricultural soils does not incur long-term storage or landfill charges.
2. How Much Insect Control is Enough in Seedling Corn?
Ric Bessin, Extension Entomology
Department of Entomology, University of Kentucky
So you have a Bt corn hybrid and the seed is treated with a systemic insecticide, do you need to worry about insect pests? Well, the answer is . . . probably not, but there are some pests and / or situations that can cause some problems. Getting a uniform plant stand with uniform vigor is one of the first steps to reaching the yield potential of a hybrid this year. In this article I will discuss a few unusual situations where our preventive controls may not always provide the level of control that is needed.
|
|
Image 1: Wireworm |
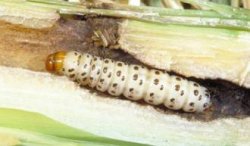
Image 2: Southwestern Corn Borer |

Early in the season we worry about uniform stand establishment and use seed treatments to protect against seedling losses to seedcorn maggot, white grubs, wireworms, and cutworms. The seed treatments do a fine job to protect seeds and seedlings in nearly all fields, but excessive pest levels, cold soils and slow germination, and some hybrids with weak vigor can contribute to increases losses to seedling pests. These problems are often associated with a history of problems in the same field in the previous year or two. As an example, we have seen serious stand losses to wireworms that required replanting when treated seed was used, but the field had a history of serious wireworm losses, was planted very early into cold soils (it took 21 days to spike through), and was a hybrid with low to moderate seedling vigor. Replanting with the same treated hybrid seed into warmer soils enabled rapid germination and growth provided an excellent stand. Seed treatments with higher levels of the insecticide active ingredient will provide higher levels of protection, and protection for longer periods of time, than that provided by the low rates.
This year we are likely to have fewer fields planted very early due to the prolonged wet cool weather across much of the commonwealth, with a few growers feeling that there are getting corn planted later than usual. This is likely to potentials reduce risk with wireworms. While planting corn in mid to late April doesn't increase risk to corn borers, plantings in May are at greater risk to both European and southwestern corn borers late in the season (second and third generations).
Growers using Bt corn for corn borer control or stalk corn borer/rootworm hybrids should consider using these with their later plantings. Growers not using Bt hybrids will need to scout their fields to monitor for corn borer larvae feeding in whorls, leaf axils, and leaf midribs beginning mid July. Foliar treatments for corn borers are only effective when applied before the larvae begin to tunnel into the stalk. Generally, the larvae will begin stalk tunneling when they reach the 4th instar stage.
Bt Technologies for Corn Insect Management
There is now a wide variety of Bt technologies to manage many of our more difficult to control corn insect pests. These different technologies may use different proteins developed from genes belonging to various Bacillus thuringiensisstrains. There are many differences between these different technologies that are sold under different trade names. Generally, in Kentucky, these products provide very good control of the insect pests that they indicate they will control. They perform as advertised in our state. However, with the Bt technologies for Lepidoptera (corn borer and its allies) control, there are significant differences in the spectrum of pests that are listed for the different technologies. While they all target and provide very good control of both corn borer species, some will also control additional Lepidopteran pests which are more common in the southern cornbelt including corn earworm, black cutworm, fall armyworm, true armyworm, and lesser corn stalk borer. The table below lists the technologies currently available:
Table 1. Bt technologies currently available for corn in the United States.
| Corn Borer BT | Rootworm BT | CB+RW BT (Stacked) |
|
YieldGard CB Herculex 1 Agrisure CB YieldGard VT Pro |
YieldGard RW Herculex RW Agrisure RW YieldGard VT RW |
YieldGard Plus Herculex Xtra Agrisure CB/RW YieldGard VT3 YieldGard VT3 Pro |
Syngenta recently had a new Bt technology approved by the EPA (although USDA approval is still pending) for its VIP3A (vegetative insecticide protein for Bacillus thuringiensis). This will target several Lepidopteran insect pests of corn.
3. Corn Seeding Rates
Chad Lee, Grain Crops Extension
Department of Plant and Soil Sciences, University of Kentucky
Several seeding rate studies in corn were conducted over the last five years to determine if seeding rates recommendations for corn should be changed. Various seeding rates spanned 20,000 to 45,000 seeds per acre. Studies were conducted at the Woodford County Animal Research Center (ARC) on a Maury silt loam from 2003 through 2007. Another study was conducted on seeding rates at the Spindletop Research Farm near Lexington, KY on a Loradale silt loam in 2008. The ARC site contained both rainfed and irrigated corn. All hybrids tested had at least one GMO trait, while some had multiple GMO traits.
Available water impacted the ideal seeding rate. Under rainfed conditions, when water was adequate, corn reached maximum yields when seeded near 30,000 seeds per acre. Yields were not increased for seeding rates higher than 30,000. For well-irrigated fields, maximum yields occurred between 30,000 and 40,000 seeds per acre. When weather was extremely dry, the lowest seeding rate tested resulted in the highest yields.
Yields for each year are addressed in a longer research update, available online at: http://www.uky.edu/Ag/GrainCrops/Research/cornseedingrate2008.htm
Partial returns were calculated for 2004, 2006 and 2007, years when rainfall was adequate and yields were acceptable. Partial returns were the gross return minus the seed cost. For rainfed corn, when water was adequate, partial returns were maximized at 30,000 seeds per acre, while irrigated corn maximized partial returns near 33 to 34,000 seeds per acre (Figure 1). These findings are very close to current University of Kentucky recommendations.
Farmers constantly question seeding rates, and there may be some fields with exceptionally high yield histories that could benefit from higher seeding rates. If you believe you have such a field, then conduct a good on-farm study to see how high you can go. Include at least four seeding rates and include a range below and above where you think you need to be. Also, spread the range in rates in increments of 5,000. For example, you think your seeding rate should be 35,000 seeds per acre. Include a test with 30,000, 35,000 and 40,000 and 45,000 seeds per acre. If possible, repeat each of those seeding rates several times in the field. Use of GPS guidance systems and variable rate planters can make this process very simple. Keep good records and take a stand count when the corn has about three or four leaves. Use your calibrated yield monitor on your combine to record the yields.
Your local county extension agent can help you set up a study and analyze the results.
Figure 1. Partial returns calculated and predicted for studies conducted 2004, 2006 and 2007 at Woodford County Animal Research Center, University of Kentucky.
Note: Partial return calculated as the gross return ($/bu * bushels/acre) minus seed cost ($/80,000 seeds * seeds/acre). Harvesting, drying, trucking and irrigation costs were not factored into this example. The solid line is the average response curve. The blue dash lines are the 95% confidence bands and the red dotted lines are the 95% predicted lines.
4. Soybean Seeding Rates
Chad Lee, Grain Crops Extension
Department of Plant and Soil Sciences, University of Kentucky
Recent research in Kentucky suggests that full season soybeans in 15-inch rows with a final stand of 100,000 plants per acre will maximize yield. For double-crop soybeans, the final stand needs to be closer to 140,000 plants per acre (possibly higher in some years).
An article was posted December 2008 (Vol. 8, Issue 4) about adjusting seeding rates to obtain 100,000 seeds per acre. That table (Table 1) has been modified to include double-crop soybeans. Table 2 was developed to help producers go from seeds per acre to pounds per acre.
Table 1. Seeding rates needed to get a final stand of 100,000 (full season) or 140,000 (double-crop) plants per acre, based on germination rate of seed and assumed stand loss in the field.
Season |
Target Stand |
Seed Germ. |
Initial Seeding Rate |
Assumed Stand Loss |
Final Seeding Rate |
Row Spacing (inches) |
||
|
7.5 |
15 |
30 |
|||||
|
plants/acre |
|
seeds/ac |
|
seeds/acre |
seeds per foot |
||
Full Season |
100,000 |
85% |
117,647 |
5% |
123,839 |
1.8 |
3.6 |
7.1 |
|
100,000 |
90% |
111,111 |
5% |
116,959 |
1.7 |
3.4 |
6.7 |
|
100,000 |
95% |
105,263 |
5% |
110,803 |
1.6 |
3.2 |
6.4 |
|
100,000 |
85% |
117,647 |
10% |
130,719 |
1.9 |
3.8 |
7.5 |
|
100,000 |
90% |
111,111 |
10% |
123,457 |
1.8 |
3.5 |
7.1 |
|
100,000 |
95% |
105,263 |
10% |
116,959 |
1.7 |
3.4 |
6.7 |
|
100,000 |
85% |
117,647 |
20% |
147,059 |
2.1 |
4.2 |
8.4 |
|
100,000 |
90% |
111,111 |
20% |
138,889 |
2.0 |
4.0 |
8.0 |
|
100,000 |
95% |
105,263 |
20% |
131,579 |
1.9 |
3.8 |
7.6 |
|
100,000 |
85% |
117,647 |
30% |
168,067 |
2.4 |
4.8 |
9.6 |
|
100,000 |
90% |
111,111 |
30% |
158,730 |
2.3 |
4.6 |
9.1 |
|
100,000 |
95% |
105,263 |
30% |
150,376 |
2.2 |
4.3 |
8.6 |
Double Crop |
140,000 |
85% |
164,706 |
5% |
173,375 |
2.5 |
5.0 |
10.0 |
|
140,000 |
90% |
155,556 |
5% |
163,743 |
2.3 |
4.7 |
9.4 |
|
140,000 |
95% |
147,368 |
5% |
155,125 |
2.2 |
4.5 |
8.9 |
|
140,000 |
85% |
164,706 |
10% |
183,007 |
2.6 |
5.3 |
10.5 |
|
140,000 |
90% |
155,556 |
10% |
172,840 |
2.5 |
5.0 |
9.9 |
|
140,000 |
95% |
147,368 |
10% |
163,743 |
2.3 |
4.7 |
9.4 |
|
140,000 |
85% |
164,706 |
20% |
205,882 |
3.0 |
5.9 |
11.8 |
|
140,000 |
90% |
155,556 |
20% |
194,444 |
2.8 |
5.6 |
11.2 |
|
140,000 |
95% |
147,368 |
20% |
184,211 |
2.6 |
5.3 |
10.6 |
|
140,000 |
85% |
164,706 |
30% |
235,294 |
3.4 |
6.8 |
13.5 |
|
140,000 |
90% |
155,556 |
30% |
222,222 |
3.2 |
6.4 |
12.8 |
|
140,000 |
95% |
147,368 |
30% |
210,526 |
3.0 |
6.0 |
12.1 |
Obtaining a desired seeding rate is based on germination rate of the seed and field conditions (assumed stand loss). For example, if your target population is 100,000 plants per acre and your seed germination is 95%, then you would need 105,263 seeds per acre. If you are planting in excellent conditions, then you might assume a minimal stand loss of 5%. So, you would need to plant 110,803 seeds per acre to get a target stand of 100,000 plants per acre. If, your seed germination rate is the same (95%), but you are planting into poor conditions, you might assume a 30% stand loss and then plant 150,376 seeds per acre.
Your challenge is to determine what expected stand losses might occur in any field. Fields prone to crusting or those that tend to stay cool and wet will have a higher assumed stand loss value than fields that are well drained or have no crusting problems. Fields planted under cool temperatures (usually fields planted earlier) will probably have a higher assumed stand loss than those planted when temperatures are warmer. Double-crop fields that are dry during planting probably have a higher stand loss than full season fields with good moisture.
If you are not certain about stand establishment, conduct some stand counts when soybean plants are relatively small. Make notes of factors that may have favored or hurt stand establishment. These notes could help you fine tune seeding rates for the next season.
Table 2. Seeding rate calculated into pounds per acre based on initial seeding rate and seed size.
Season |
Final Seeding Rate |
Seed Size |
Seed Rate |
Seed Size |
Seed Rate |
Seed Size |
Seed Rate |
|
seeds/ac |
seeds/lb |
lbs/acre |
seeds/lb |
lbs/acre |
seeds/lb |
lbs/acre |
Full Season |
123,839 |
2500 |
50 |
3000 |
41 |
3200 |
39 |
|
116,959 |
2500 |
47 |
3000 |
39 |
3200 |
37 |
|
110,803 |
2500 |
44 |
3000 |
37 |
3200 |
35 |
|
130,719 |
2500 |
52 |
3000 |
44 |
3200 |
41 |
|
123,457 |
2500 |
49 |
3000 |
41 |
3200 |
39 |
|
116,959 |
2500 |
47 |
3000 |
39 |
3200 |
37 |
|
147,059 |
2500 |
59 |
3000 |
49 |
3200 |
46 |
|
138,889 |
2500 |
56 |
3000 |
46 |
3200 |
43 |
|
131,579 |
2500 |
53 |
3000 |
44 |
3200 |
41 |
|
168,067 |
2500 |
67 |
3000 |
56 |
3200 |
53 |
|
158,730 |
2500 |
63 |
3000 |
53 |
3200 |
50 |
|
150,376 |
2500 |
60 |
3000 |
50 |
3200 |
47 |
Double Crop |
173,375 |
2500 |
69 |
3000 |
58 |
3200 |
54 |
|
163,743 |
2500 |
65 |
3000 |
55 |
3200 |
51 |
|
155,125 |
2500 |
62 |
3000 |
52 |
3200 |
48 |
|
183,007 |
2500 |
73 |
3000 |
61 |
3200 |
57 |
|
172,840 |
2500 |
69 |
3000 |
58 |
3200 |
54 |
|
163,743 |
2500 |
65 |
3000 |
55 |
3200 |
51 |
|
205,882 |
2500 |
82 |
3000 |
69 |
3200 |
64 |
|
194,444 |
2500 |
78 |
3000 |
65 |
3200 |
61 |
|
184,211 |
2500 |
74 |
3000 |
61 |
3200 |
58 |
|
235,294 |
2500 |
94 |
3000 |
78 |
3200 |
74 |
|
222,222 |
2500 |
89 |
3000 |
74 |
3200 |
69 |
|
210,526 |
2500 |
84 |
3000 |
70 |
3200 |
66 |
Note: Calculation from seeds per acre to pounds per acre is:
(pounds/acre) = (seeds/acre) ÷ (seeds/pound).
5. Average Crop Revenue Election (ACRE) Program
Cory Walters, Commodity Marketing Extension
Department of Agricultural Economics, University of Kentucky
In the 2008 Farm Bill the United States Department of Agriculture (USDA) released a new
provision called Average Crop Revenue Election (ACRE) program. Beginning with the 2009 crop year producers will have the choice, before or on August 14, whether or not to enroll in the ACRE program. Selecting to participate is made by farm number (hereafter referred to as a "farm") and everyone involved (i.e., tenant, landlord, etc.) must agree to sign up. Participating in ACRE will result in reducing direct payments by 20 percent, marketing loan rates by 30 percent, and forgoing any counter-cyclical program payments. When a farm elects to participate in ACRE that farm will be required to continue in the ACRE program over the life of the 2008 Farm Bill (2009-2012). Additionally, any farm not involved in ACRE can elect to participate for the following crop year at any time over the life of the 2008 Farm Bill. By enrolling a farm into ACRE the producer enrolls all eligible crops on that farm in ACRE. The USDA will not make any ACRE payments before the end of the crop year. To sign up in ACRE producers must elect ACRE then annually enroll in ACRE. Electing to participate but not enrolling results in forgoing any ACRE payments. The timing of ACRE payments will be made beginning October 1 or as soon as possible after end of marketing year.
For more information on how the ACRE program works and access to the online University of Kentucky ACRE calculator please visit: http://www.ca.uky.edu/agecon/index.php?p=110
6. Going Paperless
The Corn and Soybean Newsletter will likely go to an online only version by July of 2009. If you have been receiving the hard copy, please go online click on Sign Up for Newsletter and sign up for the electronic version. We apologize for any inconveniences that this may cause you.
printer-friendly pdf (Note: this html site is also printer-friendly)