
The Kentucky Geological Survey has archived this material, meaning (1) it is for reference, research, or recordkeeping; (2) it was created before April 24, 2026; (3) and the material has not been changed or altered since being archived. Please refer to our KGS Accessibility page for more information.
KGS Home >
Earth Science Education
Cents of Time

adapted by Stephen Greb
Introduction
In this exercise, students will learn how absolute age dating works. Students will toss pennies and plot their results on a graph. The experimental probability graph will be used as a model for absolute age dating. Students will use their graph (or a class data set graph) to calculate the age of some hypothetical unknowns to develop a better understanding of how rocks are dated using absolute age dating methods.Materials
Terms-Vocabulary
absolute dating, relative age dating, isotope
daughter isotope, parent isotope
BackgroundHow can scientists tell the age of a fossil? There are two general methods. The first is called relative age dating . In relative dating, the position of a fossil or the layer in rock in which a fossil occurs is determined to be relatively older or younger than another layer by its position. In any stacking of undisturbed, horizontally bedded sedimentary rock units, the oldest strata are at the bottom of the stack and the youngest are at the top of the stack. Fossils in lower layers are relatively older than fossils in upper layers. If the age of a layer is known, then the fossils or rock layers are relatively older or younger than that layer based on their position above or below the known layer.
The second type of age dating is called absolute age dating . Absolute age dating uses a known rate of change of some physical characteristic to determine how much change has taken place. The most common rates used are the decay rates of radioactive elements; sometimes termed radiometric dating. The decay process involves the changing of isotopes of elements. Isotopes are varieties of the same element. When an element is formed, for example, in igneous extrusive rocks, the element consists entirely of one type of isotope (the parent isotope ). Some isotopes are unstable. This means that the number of neutrons and protons in the isotope of the element will change with time. When the number of unstable neutrons and protons changes to a stable number, the new isotope is termed a daughter isotope . The time it takes for half of the parent isotopes to change to daughter isotopes is called a half life . Because the decay rate is controlled by the physics of the element, formulas can be used to calculate the half life of the element, even if the half life is much longer than you or I could ever see. Some elements have half lives of seconds, others have half lives of many billions of years. If the half life of an element is known, and you can accurately count the number of daughter and parent isotopes in an element, then you can determine the amount of time that has passed since the element formed.
In this exercise, students toss pennies to calculate a decay curve, by constructing a probability curve. A penny has two sides. There are only two chances on a flip. That's a 50:50 chance. For this exercise, heads are the parent isotopes and tails are the daughter isotopes. The class will collect data on the �isotopes� from flipping coins.
For more information about how absolute age dating works see Age Dating Key Links https://www.uky.edu/KGS/education/agedating.html at the Earth Science Education Network, Kentucky Geological Survey.
Activity• Each student should have a penny, a worksheet, and pencil. (For a small class, it may help to give students each 2 or 3 pennies to increase the number of tosses for each time (T).
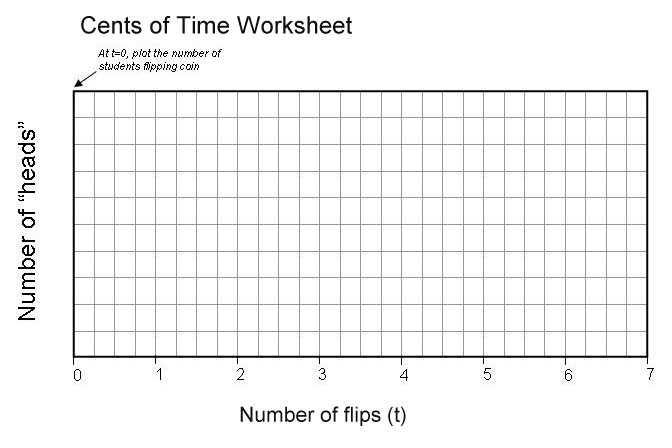
• Look at the penny decay curve worksheet. N on the vertical axis of the graph is number of parent isotopes (heads on the coin) in this exercise.
• T1, T2, T3, etc., on the horizontal axis are the number of times the coins are flipped. The time between T1 and T2 and T3, etc. is the half life of the penny element for this exercise. In nature, the time between T1 and T2, etc. would be fixed constant. The time between flips of coins does not need to be constant for the activity to work, although you can set a specific time (for example, 3 minutes between coin tosses if you want to stress the point).
• The teacher should make a graph on the chalkboard or overhead projector to record the class results. Record N, the number of students on the vertical axis of the graph (or if each student is using multiple pennies, the total number of pennies). This is the number of parent isotopes in the element at the element's formation. Have all of the students turn their pennies to heads. All of the isotopes in the penny element when it is formed are parent elements, which are heads for this activity. Count the number of parent isotopes in the class and record it on the N axis. Have the students copy the same information on their worksheets.
Link to Penny decay curve worksheets
• Now tell the students to prepare to toss their penny element. This should be a real toss of the coin. Tell the students it is time 1 (T1) or one-half live of time has passed. Have all of the students toss their penny (or each penny) once.
• If heads, then the isotope in the penny element is unchanged and remains a parent isotope. Students should raise their hand for each heads.
• If tails, then the element has changed to its daughter isotope, which is now stable, and cannot toss anymore. Place the penny in your pocket or desk. Do not flip it again during trial 1.
• The teacher and students should write the total number of parent isotopes (heads) on the graph for time 1 (the first half life of the element).
• Students should do the same on their worksheet.
• For time 2 (T2), all of the students who flipped heads (remained an unstable parent isotope) should flip their coin again. Do not flip coins that tossed tails at T1.
• Repeat 5-9, but plot the number of heads this time for T2 (the second half life of the element).
• Continue flipping for T3, T4, T5, as needed until no one tosses a heads. This means all of the isotopes in the penny element have been converted to stable daughter isotopes.
• Connect a line through the results on the graph. This is the decay curve for the penny element. Because half lives and elemental decays are a matter of probability, one trial is not enough. Repeat the exercise three times. This also reinforces the scientific testing process. Have students label their lines trial 1, trial 2, trial 3, or use different colors for each.
• At the end of three trials, there should be three decay curves on the graph. All should start at the same point for number of parent isotopes, but may differ for times T1, T2, etc.. They should all flatten out toward the end of the curve.
• Have students plot one more curve, using a different symbol (or color) for points on this curve. Instead of tossing a coin, students should calculate ½ of the number of pennies and plot their answer at T1, then calculate ½ of T1 and record the answer at T2, then calculate ½ of T2 and record the answer at T3, and so on, until the answer is less than 1. Label this curve �calculated decay curve.�
• Have students compare their calculated curve to the trial curves. The curves should be similar, but may not be the same. The calculated curve is essentially the average of the trial curves. It is an estimate of what should happen. This is how scientists use probability to calculate decay curves even if they can't see or test each element for their entire existence.
• Answer questions using the graphs constructed.
Questions
For each question the teacher should fill in numbers for students based on the number of coins tossed.
For questions 1 through 4, assume your penny element has a half life of 100 years.
• For an element with a half life of 100 years, calculate the value for T1, T2, T3, etc? T1=1/2 (100), T2=1/2(T1), T3=1/2(T2) etc.
• For rock sample 1, you count ___ (teacher should choose the number for T4 or T5 and use here) parent isotopes. How many years passed since the element was formed?
• For rock sample 2, you count ___( teacher should choose the number for T2 and use here ) parent isotopes. How many years passed since the element was formed?
• For rock sample 3, you count ___ (teacher should choose a number that has to be estimated between T2 and T3 and use here) parent isotopes. How many years passed since the element was formed?
Can you see that the longer the amount of time from when the element formed (the more half lives that have passed), the straighter the curve becomes? This can make it difficult to determine an accurate age because a wider range of time (range on the horizontal axis of the graph) has similar numbers of calculated parent isotopes. Earlier in the decay process, the curve is steeper and it is easier to determine a specific calculated N (number of parent isotopes), but there is a wider range of possibilities (test result curves). This is how absolute age dating works. For each of the elements used in radiometric dating there are ranges of time for which they are most accurate, and ranges of time where the potential error increases. Actual decay curves are plotted on logarithmic paper (log-normal) and use the ratio of daughter to parent isotopes to calculate age. The log-normal method results in a straight line, rather than a curved line, so that more accurate results can be determined for different parts of the decay curve. Also, lab results use equipment capable of very accurate measurements.
Even with the most accurate measurements, there are potential errors in the results. The error is similar to the range of values for any time in the trial results. This range of potential error can be calculated. Radiometric dates quantify this error on each result (for example 810,000 + 500 years). Also, in most real age dating facilities, multiple samples are tested, and multiple elements (with different half lives) are tested to ensure that results are consistent.
Options:
• Try answering the questions with different half lives to show students that the method is the same, but that the age will change.
• Try counting daughter isotopes instead of parent isotopes to make sure students understand how to read the graph.
• Have students estimate some error ranges for their absolute dates. They can use the range of values from their trials at any given time. Give them an N. Have students move horizontally across their graph for that N and highlight the area between the first and last line they intersect. From the first line drop a vertical line to the time line. From the last line they intersect drop a vertical line. From calculated decay curve drop a vertical line. What are the times for the first, last, and calculated lines? The average difference between the calculated line and the first and last line is the potential error for this element. The absolute age date would be written as the age based on the calculated line + the average distance of those lines away from the calculated line.
Go to Images in Time for pictures of ancient creatures
Go to Key Links in Earth History for more info and images about earth history
Back to Its About Time activities
Back to Classroom Activities
Back to Earth Science Education Network