The Kentucky Geological Survey has archived this material, meaning (1) it is for reference, research, or recordkeeping; (2) it was created before April 24, 2026; (3) and the material has not been changed or altered since being archived. Please refer to our KGS Accessibility page for more information.
KGS Home > Geologic Hazards
Earthquake Hazard and Risk
azard and risk are two fundamentally different concepts. In general terms, hazard is a phenomenon that has potential to cause harm. Phenomena are both natural and man-made. For example, earthquakes, hurricanes, tornadoes, and floods are natural hazards; whereas car crashes, chemical spills, train derailments, and terror attacks are man-made hazards. Risk, on the other hand, is the probability (chance) of harm if someone or something that is vulnerable is exposed to a hazard. In quantitative terms, hazard is defined by three parameters: a level of hazard (severity), its occurrence frequency, and location, for example, a fatal car crash (severity) in every month at a specific intersection. And risk is defined by four parameters: a probability, level of severity, time period, and location. For example, in health sciences, risk is defined as the likelihood (probability) of getting cancer (severity) if an average daily dose of a hazardous substance is taken over a 70-year lifetime. In the financial world, risk can be the probability of losing a certain amount of money (severity) over a period. The figure below shows the 23 core global risks estimated by the World Economic Forum (2007) over a 10-year exposure time. This figure also shows that risks are more useful for policy decision making.
The 23 core global risks over a 10-year time frame estimated by World Economic Forum (2007).
Although seismic hazard and risk have often been used interchangeably, they are fundamentally different (Seismic Hazard vs. Seismic Risk):
Seismic hazard is assessed from instrumental, historical, and geological records (or observations) and expressed in terms of a level of hazard and its occurrence frequency: seismic hazard curve, at a site. The figure below shows hazard curves in terms of earthquake magnitude (a) and peak ground acceleration (b) in San Francisco, California. Earth scientists, seismologists in particular, play a key role in seismic hazard assessment.
Hazard curves in terms of earthquake magnitude (a) and peak ground acceleration (b) in San Francisco, California.
Seismic risk depends not only on seismic hazard and exposure, however, but also on the models (i.e., time-independent [Poisson] and time-dependent ones) that could be used to describe the occurrences of earthquakes. High seismic hazard does not necessarily mean high seismic risk, and vice versa. For example, there are high seismic hazards in the California deserts, but low seismic risk because of few exposures (people or buildings). On the other hand, the seismic risk could be high in some areas, such as Pakistan and Iran, because of high exposures, even though the hazards may be moderate. The common model being used to describe earthquake occurrences is the Poisson distribution (time-independent: independent of the history of previous earthquakes). Other time-dependent earthquake occurrence models have also been used in seismic risk analyses. These different models will result in different risk estimates.
The figure below compares seismic hazards and risk posed by an M7.7 earthquake in the New Madrid Seismic Zone with hazards and risk posed by Hurricane Katrina in the Gulf Region.
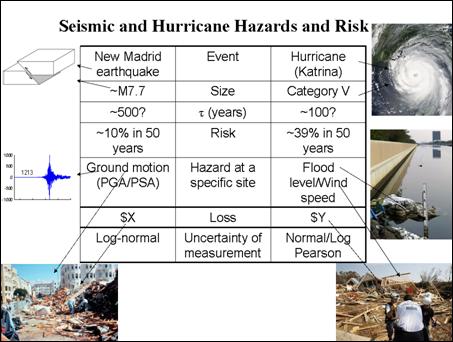
The hazards posed by earthquakes in the New Madrid Seismic Zone can be expressed as a magnitude 7.7 earthquake, a level of ground motion (i.e., peak ground acceleration), or a modified Mercalli intensity (MMI) at a site, or as total damages. Similarly, the hazards posed by Hurricane Katrina in the Gulf Region can be quantified as a category V hurricane, a level of flood or wind speed at a site, or total damages. The geological record suggest that the recurrence interval of earthquakes with about M7.7 magnitude is about 500 years in the New Madrid Seismic Zone, and the historical record indicate the recurrence interval of category V hurricanes is about 100 years in the Gulf Region. If the occurrences of earthquakes and hurricanes both follow the Poisson distribution, the risk posed by earthquakes in the New Madrid Seismic Zone can be estimated to be about 10 percent probability of exceedance (PE) in 50 years in terms of a magnitude 7.7 earthquake, a specific level of ground motion, or MMI at a site, or total losses (life and money); and the risk posed by Hurricane Katrina in the Gulf Region can be estimated to be about 39 percent PE in 50 years in terms of a category V hurricane, a specific level of flood or wind speed at a site, or total losses (life and money). If the total damage from a magnitude 7.7 earthquake is similar to that from a category V hurricane, the hurricane risk in the Gulf Region is about 4 times higher than seismic risk in the New Madrid Seismic Zone. This comparison shows that risks are more useful for policy decision making.
Assessing seismic hazards and risk is difficult because of insufficient data (records), especially in the central and eastern United States where the data on large earthquakes are very limited. This lack of data results in large uncertainties for the seismological parameters that are the basis for assessing seismic hazards and risk. Seismic hazards are commonly assessed either by probabilistic seismic hazard analysis (PSHA) or deterministic seismic hazard analysis (DSHA). The fundamental difference between PSHA and DSHA is in how the uncertainties are treated: either implicitly (PSHA) or explicitly (DSHA). Although PSHA has been more widely used, our studies show that it may not be appropriate because it has some intrinsic drawbacks (see Current Research for more detailed information).
Most damage during an earthquake is caused by ground motion (see Figure 1 ). A commonly measured ground motion is peak ground acceleration ( PGA ), which is expressed as a percentage of the acceleration of gravity ( g ). The larger an earthquake's magnitude, the stronger the ground motion it generates. The level of ground motion at a site depends on its distance from the epicenter -- the closer a site is to the epicenter, the stronger the ground motion, and vice versa. Ground motion from a major earthquake in the New Madrid Seismic Zone is expected to be much stronger in western Kentucky than in the central and eastern parts of the state. Strong ground motion could also induce secondary hazards such as ground-motion amplification , liquefaction , and landslide under certain site conditions.Figure 1
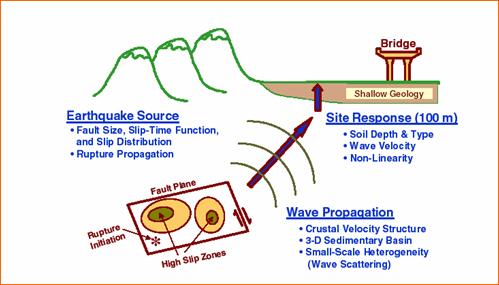
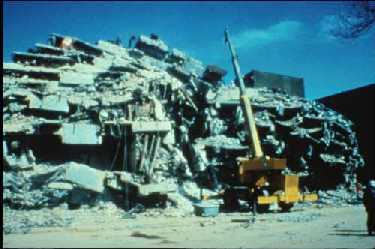
The local geology and soil also play very important roles in earthquake damage. Soft soils overlying hard bedrock tend to amplify the ground motions -- this is known as ground-motion amplification (see Figure 1). Amplified ground motion can cause excess damage, even to sites very far from the epicenter. Ground-motion amplification contributed to the heavy damages in Mexico City during the 1985 earthquake (see Figure 2) and in the Marina District of San Francisco during the 1989 Loma Prieta earthquake; both areas were more than 100 km away from the epicenters. Figure 2 shows the total collapse of the Juarez Hospital in Mexico City, caused by the amplified ground motion during the earthquake of September 19, 1985. Many communities in Kentucky are set on soft soils, especially those along the Ohio and Mississippi River Valleys. Those communities are prone to ground-motion amplification hazards. For example, most of the damage in Maysville during the Sharpsburg earthquake of July 27, 1980, was caused by amplified ground motion.
Figure 2
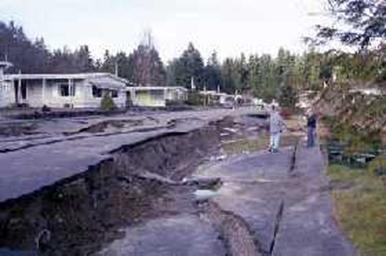
Soft sandy soils can be liquefied by strong ground motion -- a process called liquefaction. Liquefaction can result in foundation failure. Figure 3 shows that sandy soil was liquefied and behaved like fluid during the Nisqually, Washington , earthquake of February 28, 2001. Many communities in Kentucky are set on soft soils, especially those along the Ohio and Mississippi River Valleys . Those communities may also be prone to liquefaction hazards.
Figure 3
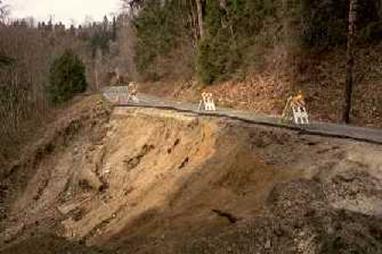
Strong ground motion can also trigger landslides -- known as earthquake-induced landslides -- in areas with steep slopes, such as eastern Kentucky. The slope failure shown in Figure 4 was caused by the Nisqually earthquake of February 28, 2001.
Figure 4