Miscellaneous geographic charts showing significant relationships with the outcrop pattern of the state (pl. II, fig. 2) and the recognized physiographic regions (pl. II, fig. 1)
| PLATE LVI Miscellaneous geographic charts showing significant relationships with the outcrop pattern of the state (pl. II, fig. 2) and the recognized physiographic regions (pl. II, fig. 1) |
|
|
|
|
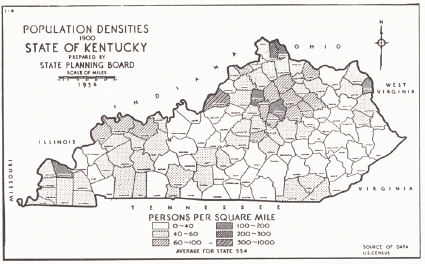
| FIG. 2. Population densities, 1930 (ibid.). | |
|
|
|
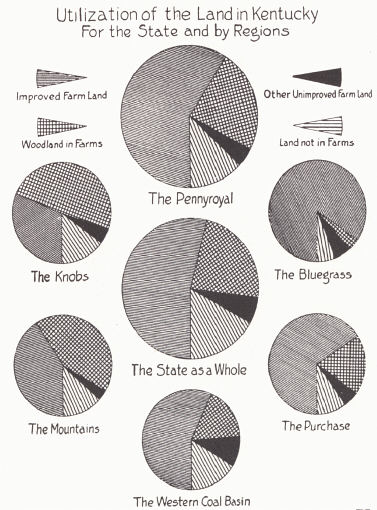
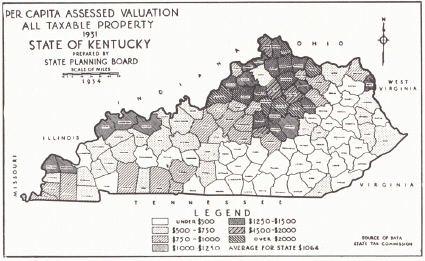
| FIG. 1. Utilization of the land in Kentucky (Sauer, 1927). | FIG. 3. Assessed valuation of all taxable property, 1931 (ibid.). |
|
|
|
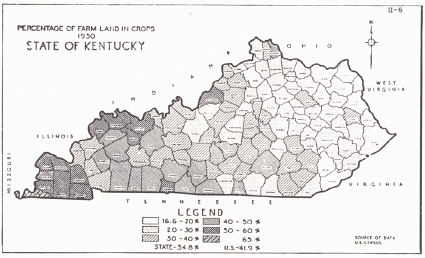
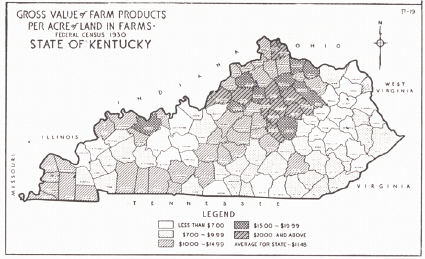
| FIG. 4. Percentage of farm land in crops, 1930 (State Planning Board, 1935). | FIG. 5. Gross value of farm products per acre of land in farms, 1930 (ibid.). |
|
|
|
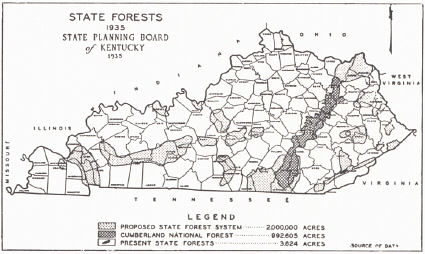
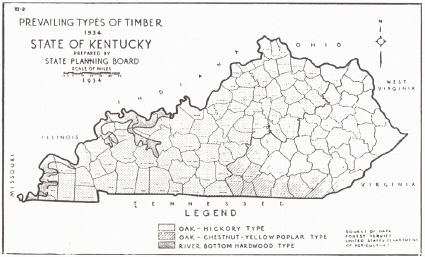
| FIG. 6. State forests (ibid.) | FIG. 7. Prevailing types of timber (ibid.). |
| PLATE LVII Miscellaneous geographic charts showing significant relationships with the outcrop pattern of the state (pl. II, fig. 2) and the recognized physiographic regions (pl. II, fig. 1) |
|
 |
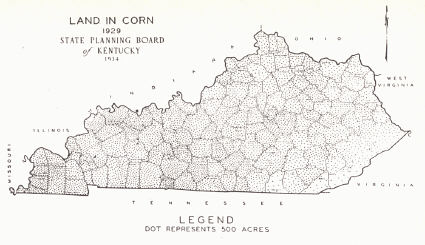 |
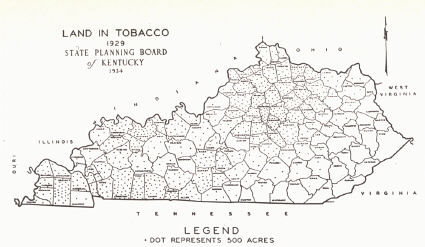
| FIG. 1.-Land in tobacco, 1929 (State Planning Board, 1935). | FIG. 2.-Land in corn, 1929 (ibid.). |
 |
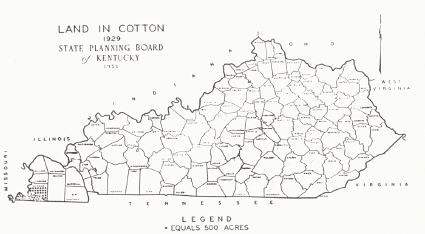 |
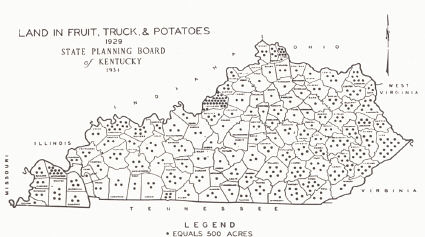
| FIG. 3.-Land in fruit, truck, and potatoes (ibid.). | FIG. 4.-Land in cotton, 1929 (ibid.). |
 |
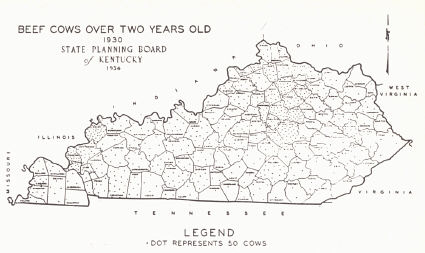 |
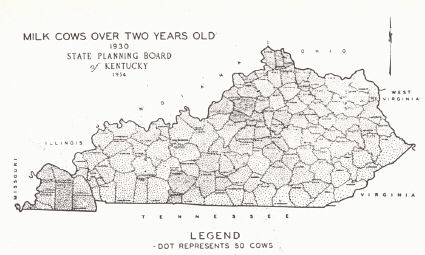
| FIG. 5.-Milk cows over two years old, 1930 (ibid.). | FIG. 6.-Beef cows over two years old, 1930 (ibid.). |
 |
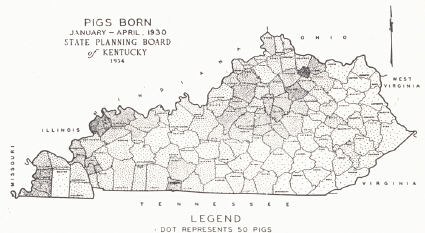 |
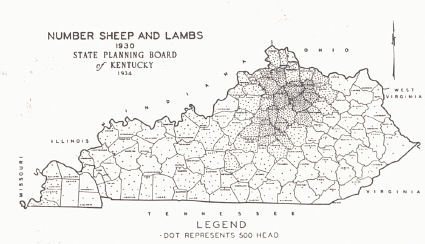
| FIG. 7.-Number sheep and lambs, 1930 (ibid.). | FIG. 8.-Pigs born, January to April, 1930 (ibid.). |
| PLATE LVIII Miscellaneous geographic charts |
|
 |
 |
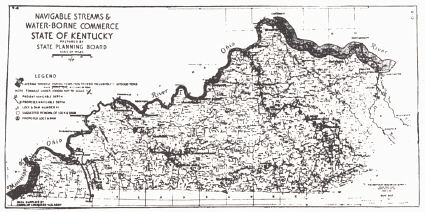
| FIG. 1. Navigable streams and
water borne commerce (State Planning Board, 1935). |
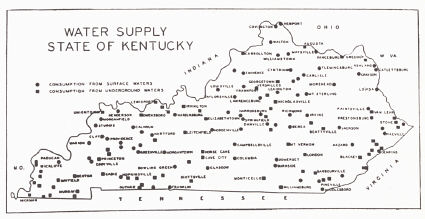
FIG. 2. Water supply (adapted from State Planning Board, 1935). |
 |
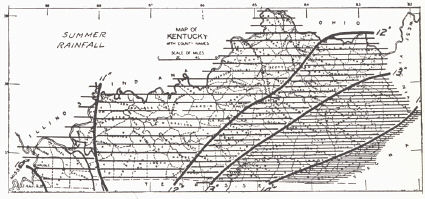 |
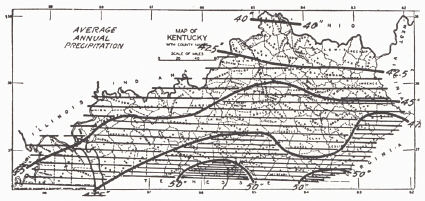
| FIG. 3. Average annual precipitation (Visher, 1929). | FIG. 4. Summer rainfall (ibid.). |
 |
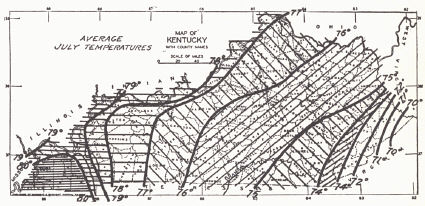 |
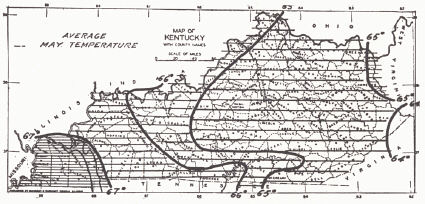
| FIG. 5. Average May temperature (ibid.). | FIG. 6. Average July temperature (ibid.). |
 |
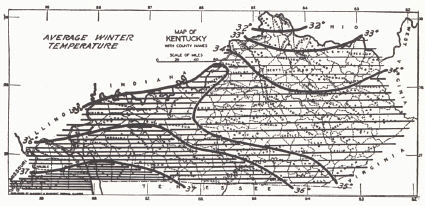 |
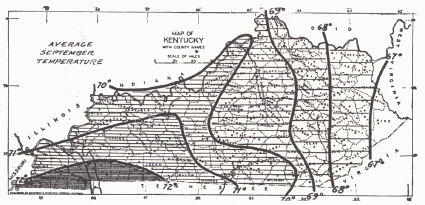
| FIG. 7. Average September temperature (ibid.). | FIG. 8. Average winter temperature (ibid.). |