Water Distribution
System Toolkit
Hardware/Software Integration: Real Time Modeling
Since measurement of hydraulic and water quality dynamics in pipe networks is performed at relatively few locations, network models are important tools for understanding network-wide flow dynamics, and their impact on the evolution of water quality. Many water utilities have developed computer models of water distribution systems as a tool for system design and analysis. Although great effort has been invested in such models, most of them are limited to off line analysis. These models are calibrated with data sampled during certain periods of time (usually several days) and only simulate the hydraulic and water quality conditions under specific water demand and operational scenarios. Despite the relatively wide application of SCADA systems, and the presumably vast amount of data stored within these archives, water distribution system models are not updated frequently, nor compared to historical SCADA records.
Off line models may not accurately represent the hydraulic or water quality behavior of water distribution systems under typical variability in water demands and operational response. Water utility operations will greatly benefit from the development of real-time network models since such models will provide a powerful mechanism to synthesize SCADA data and analyze/predict the network system performance under different operational scenarios. Such analysis will likely lead to better water quality predictions and improved anomaly/event detection, as well as dual-benefits such as improved energy efficiency or disinfectant residual management, because operators would have a consistently reliable tool to determine how system operational changes affect current and forecasted hydraulic and water quality behavior.
While off-line computer models (both hydraulic and water quality) can be used to improve the overall operations of a water distribution system, further improvement may be obtained through the use of models in a real-time or on-line environment. Water distribution systems are designed and operated to satisfy a range of objectives, including hydraulic performance. Metrics of hydraulic performance include pressure levels, fire protection, water quality, and various measures of system reliability. Real time monitoring can be used to identify the status of a water distribution system at a particular point in time. By archiving such data, subsequent statistical analysis can be performed to identify various performance trends under different conditions. Use of an on-line or (real time) hydraulic model can be further used to evaluate the future performance of the system under different conditions.
Water utilities are frequently faced with the challenge of having to respond to a range of different emergency situations. Such emergencies can included pipe breaks, component failures (e.g. pumps), low pressure issues, cross connections, and contamination events (either accidental or intentional). Real-time hydraulic models can be used to evaluate the impact of such emergencies on the future status of the system as well as for use in evaluating possible response actions. Water quality management continues to be a significant challenge for water distribution system operators, especially in light of increasing water quality regulations. The use of real time water quality models provides the opportunity for system operators to improve the water quality of their delivered product by having the capability to model the water quality impacts of different operational changes in the system as well as to explore the impact of the location of regional chlorine booster stations.
Hydraulic/water quality simulation models can be applied in a real-time environment in three different levels: archived simulation, real-time forecasting, and real-time control. At the heart of each level is a SCADA system that collects and logs data, monitors the operational status of the system, and transmits operator's directives to various control devices in the field (see Figure 1). In archived simulation (see Figure 2), the simulation model is integrated with the SCADA system database for use in evaluating previous historical data sets for the purpose of evaluating general operating rules or for use in predicting the possible performance of the system for similar scenarios. The next level of real-time simulation, shown in Figure 3, is the computer-assisted command structure sometimes called real-time forecasting. This control structure provides operators with an interactive environment incorporating a SCADA system linked with software capable of predicting the state of the hydraulic system. The software will typically involved two basic components: 1) a demand forecast model and 2) a hydraulic/water quality model of the distribution system. The demand forecast model will typically be integrated with the SCADA system so as to provide real-time forecasts of system demand which are then fed as boundary conditions to the hydraulic/water quality simulation program. The final level of real time simulation is the computer-directed command structure shown in Figure 4. The computer-directed structure is often called real-time control because the structure is able to provide an optimal operating policy based on prescribed operational goals. As a result, this level of operations involves three different software components: 1) a demand forecast model, 2) a hydraulic/water quality model, and 3) an optimal control model.
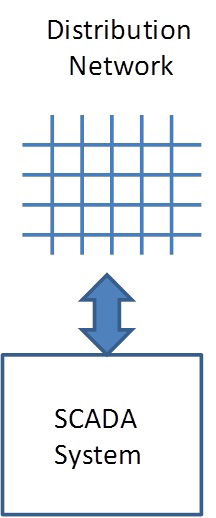
Figure 1. Heart of Real Time Operating Environment
With respect to the minimization of operational costs, the purpose of an optimal control system is to provide the operator with the least-cost operation policy for control units (e.g. pump stations, booster chlorinators, etc.) in the water-supply system. The operation policy for a system is simply a set of rules or a schedule that indicates when a particular control unit or group of control units should be turned on or off over a specified time period. The optimal policy should result in the lowest total operating cost for a given set of boundary conditions and system constraints.
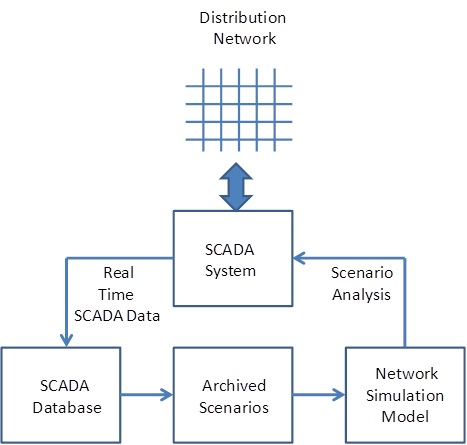
Figure 2 Archived Simulation
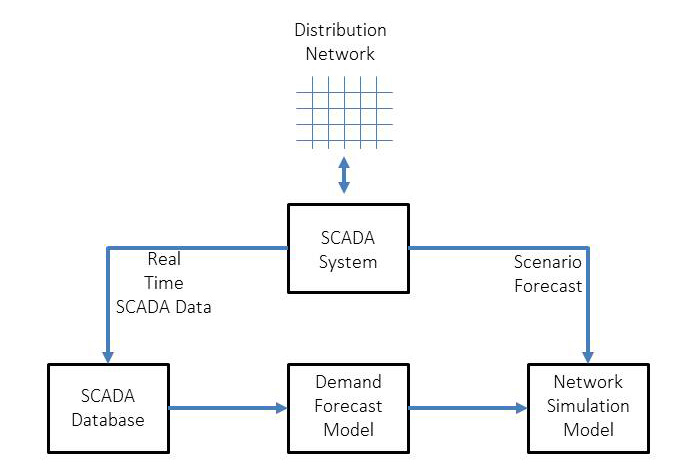
Figure 3 Real Time Forecasting
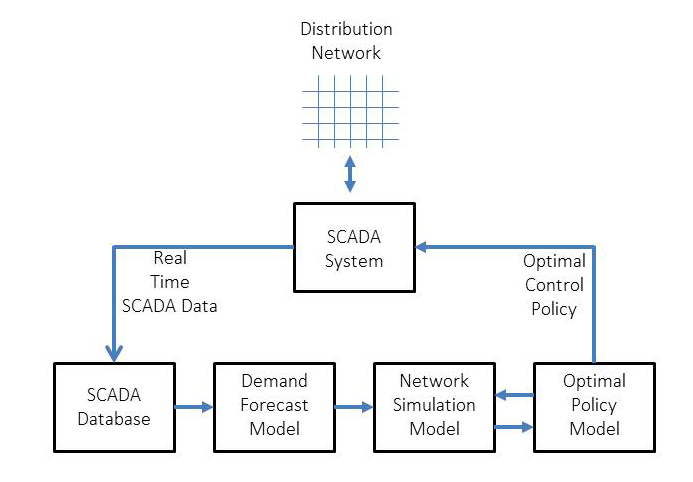
Figure 4 Real Time Control
Model/SCADA Integration/Calibration
While two of the major network analysis software vendors (i.e. MWH Soft and Haestad Methods) have developed SCADA interfaces for their distribution models, neither have seen much commercial application. To date, virtually no studies have looked at the practical benefits and limitations of such technologies to real systems. In particular, it is currently unclear how system flow dynamics might affect the performance of such systems (e.g. on accurate water quality predictions) - both for normal operations and for detection of possible incursions to the system.
Part of the reason for the limited use of real-time modeling is because of the challenges of making the interface connection between the model and the SCADA database. The subsequent discussion assumes that EPANET will be used for the software model, however similar steps would be required for other models as well. Typical steps involved in integrating a model with a SCADA system include:
-
A general software system has to be developed for linking the hydraulic and water quality models, with the utility SCADA database. As part of this research, software was developed for use in linking EPANET with an actual utility SCADA system.
-
Next, the software system has to be configured to link real time data on tank and clearwell water levels to boundary conditions of the network model, and to link real time data on pump operation to pump status in the network model. In addition, data on water source flow rates and tank water levels have to be processed to estimate zoned water demand variations, so that the real-time model can reflect those demand variations through adjustments of the demand multipliers.
-
A comprehensive statistical comparison of hydraulic model predictions and distribution system hydraulic measurements has to be performed for an extended historical analysis period (at least one year). This will require identification of SCADA tags associated with pressure and flow measurements with associated network model objects.
-
A comprehensive statistical comparison of water quality model predictions and distribution system water quality measurements then needs to be performed for an extended historical analysis period (at least one year). This will require identification of SCADA tags associated with water quality measurements with associated network model objects. It will also require the development of appropriate water quality reaction dynamics models to predict the water quality sensor signals; these water quality models will be developed and integrated into EPANET-MSX, the multi-species water quality network modeling extension to EPANET
-
Verification studies will then need to be performed by selecting locations for additional pressure measurements, and installing integrated pressure transducers and data loggers at fire hydrants. These will collect data for a shorter period of 1-3 months, at which time these additional data will be harvested and integrated with the telemetered SCADA database, and a similar statistical analysis performed on this verification data set. The pressure monitoring will be conducted at locations that are deemed to be the least reliable, or to represent the greatest variability, to test the model accuracy under the most stressed conditions.
-
A comprehensive data analysis will then need to be performed to understand the variability of network hydraulics and water quality in this large system over an extended time of actual operation. Specifically, since water quality evolution is dependent on the flow paths through the network and the velocity of those paths, an analysis will be performed to quantify the variability in flow paths as predicted by the real-time calibrated hydraulic model. These analyses will be based on previous work by the research team to quantify network flow paths using particle backtracking, and associated software.
-
Finally, the ability of the real-time models to provide realistic predictions of future states and deviations from such states (i.e. as a result of a water quality contamination event) will then need to be determined. This assessment and results of previous tasks will support recommendations about how real-time hydraulic and water quality models can best be used to support improved real-time event detection, and at what cost.
Implementation Strategies and Barriers for Real-Time Modeling
James G. Uber, Ph.D.
Potential Barriers to Real-Time Implementation
The future of network modeling will undoubtedly rely on an increased level of model-data integration. The drivers toward that end are strong: less expensive sensors and data communications technologies are creating a richer data environment in terms of number, type, and density of information; less expensive and more powerful ways to store and access data with mobile platforms are challenging traditional solutions that tie analysis to the desktop; and increasing interest in the water sector from traditional information technology companies will drive up the technology expectations of water utilities. There will, however, be a period of transition, and given the heterogeneity of the water industry sector in terms of size/resources, this period may be prolonged, especially for the (significant) number of utilities in the bottom half in terms of resource availability.
One particular barrier to real-time data integration - very much related to the lack of vision for continuous use of data - is the particular problem involving the collection, sharing, and quality assurance of water pipe network infrastructure data. These data have largely been collected in isolation and under the purview of a small number of engineers, and it is not surprising that they are often not trusted outside of that small cadre of individuals. Specifically, operations staff are often distrustful that the infrastructure data, as encoded in a hydraulic network model, represent the true state of the system. All areas are open to suspicion - in particular the status of isolation valves, and the accurate representation of pipeline, pump, and control valve characteristics. As part of the development of an organization wide vision of data sharing and use, these suspicions must be allowed to surface, be discussed, and find resolution -- in ways that are helpful and non-confrontational. It must be emphasized that such problems of trust in infrastructure data are, often frustratingly, the same problems that would be the target of a comprehensive vision of data sharing and use. That is why the development of such a vision is paramount in importance -- without it as a framework to set expectations, the status quo of data access restriction and mistrust is allowed to continue, often unspoken except within trusted groups.
Finally, the simplest barrier to overcome is the one of insufficient data that must be used to drive real-time model predictions. This is the simplest because of the availability of straightforward requirements, and software/hardware technology for implementation. The first requirement is that SCADA data access must be available either through industry standard OPC (on-line process control) data connections, or through SCADA historical databases. The choice of data access method will depend on the downstream software requirements, but SCADA historians are implemented using standard database technologies and allow for flexibility in integrating with various applications. Thus one very straightforward question is whether or not such a historian was implemented with the SCADA system delivery, as it is normally an optional product. Connection through OPC data access layers can create tension with SCADA managers, who are always concerned about outside software connections to SCADA and may want to scrutinize downstream software design and requirements.
Once data access is assured, minimum data requirements can be presented and assessed. First, a system flow balance must be possible using only real-time flow and level sensor data (i.e. not relying on assumptions about average production rates. Practically, this requirement means that all floating storage tanks must include a level measure, and all supply sources must include flow measures allowing the calculation of cumulative flow rates at all points of entry to the distribution system. It is highly suggested that all significant points of supply have actual flow measures -- in particular, significant unregulated wholesale supplies should be metered, and have those values available through real time data acquisition, rather than being replaced by an average rate or historical diurnal curve (while the latter approach is feasible for real-time model implementation, it ignores demand variability and as such is not recommended). In addition, all significant control elements must have their status either monitored directly and available via SCADA, or have adequate data streams that allow their status to be inferred from real-time data analytics. The control elements that must be included are any pump or control valve that is under direct operator or automatic control. Sometimes the necessary data streams may be available, but they may not have been configured for storage in the SCADA historian database is a problem that can be corrected via SCADA configuration. Some relevant examples of SCADA data requirements follow. Any variable speed pump must have the pump speed measured and available, as it determines the pump operating characteristics (essentially replacing the “pump on/off” statuses typical of fixed speed pumps). Any fixed speed pump must have its status stored directly from contact sensors, or inferred from other data streams; other possible data streams include suction and discharge pressures, individual pump flow rate measurements, and pump run-time or Kilowatt meters. Remote control PRVs or other control valves must have their statuses monitored and available, such as the upstream and downstream pressures of a remote controlled PRV, the sensed valve stem position of a remote controlled PRV (better), or the open/closed position of a remote controlled valve (expressed as a percent or fraction open). Finally, beyond these minimum data requirements, it is suggested that system sensing include suction and discharge pressures, and total flow rates, for all pump stations, and that several pressure sensors be included within each pressure zone to allow for useful mapping of the system-wide hydraulic grade line. Additional flow and pressure monitoring should be selected with an eye toward the use of that data for improving real-time model calibration and accuracy. For example, additional flow monitors can be chosen at locations that optimally subdivide the system into demand metered areas (DMAs), within which separate demand balances can be constructed in real-time. The average size of those DMAs (in flow units) is a measure of the real-time demand disaggregation, and logically the more disaggregated the real-time demands, the more powerful the real-time model predictions and associated data analytics (e.g., for non-revenue water or leak detection within DMAs).
General Guidance and Steps for Implementing Real-Time Data Analytics and Modeling
The system integration scope can be broken down into the following work task groups:
1. Gathering and analyzing network and SCADA data
-
Collect network and mapping data.
-
Based on interviews of operations and engineering personnel, internal documentation about the network model, SCADA historian database, and standard protocols followed by operators, identify the linkages between model elements and SCADA data tags. Also identify SCADA systems software characteristics and develop preliminary plan for data extraction.
-
Identify important data gaps related to sensor data availability and adequacy of model for real-time application.
-
Develop strategies to overcome any significant obstacles related to linkage between SCADA and model elements or connection to SCADA historian database.
-
Summarize and document findings and recommendations.
2. Data acquisition and diagnosis
-
Harvest 1 year of SCADA data, at a minimum, from the SCADA historian database, either through the creation of a virtual machine that incorporates the software interfaces required to connect to the historian (preferred), or through a database export.
-
Identify important gaps related to data integrity/reliability.
-
Make recommendations for necessary improvements to instrumentation, data cleaning/filtering, and data access interfaces.
3. Building and testing the real-time hydraulic model
-
Reconfigure the hydraulic network model for real-time application, including necessary changes to model topology and detail in order to accommodate accurate data connections.
-
Perform continuous simulation of the distribution system hydraulics that reflect the actual changes in system operation as a function of system demand over the time frame represented by the harvested SCADA data.
-
Summarize the performance of the real-time hydraulic model as compared to SCADA data.
-
Identify potential model issues that may be responsible for perceived performance gaps.
-
Propose calibration activities as needed for further diagnosing and correcting any such deficiencies.
4. Perform model calibration activities
-
Develop calibration strategy, including detailed work tasks and budget.
-
Perform calibration activities.
-
Reassess the performance of the real-time hydraulic model as compared to SCADA data.
- Deliver and demonstrate end-user real-time software. Operational planning exercises should be developed to highlight the key decision support role of the real-time model. Product demonstration should involve utility operations and engineering staff using the software to develop and evaluate alternative operational schemes and their benefits.
Potential Applications of Real-Time Simulation
Water distribution system hydraulic/water quality models can be used in a range of real-time operations. These include the following:
Additional Papers
Optimal Control of Water Supply Pumping Systems
Nonlinear Heuristic for Pump Operations
Optimal Pump Scheduling for Water Distribution Systems
Actual Applications of Real-Time Simulation
-
References
Fencil, J. (2010). “Lessons learned from Drills and Exercises at the Greater Cincinnati Water works.” World Environmental and Water Resources Congress, Providence, RI.
Hart, D. B., and McKenna, S. A. (2009). “CANARY user’s manual.” Version 4.1, EPA/600/R-08/040A, U.S. Environmental Protection Agency, Office of Research and Development, National Homeland Security Research Center, Cincinnati, OH.
Irving, J., Taggart, T., Reilly, B., Spangler, L. (2010). “CANARY - Philadelphia Water Department’s Investigation into using CANARY to monitor OWQM Sites.” World Environmental and Water Resources Congress, Providence, RI.
NRC. (2005) . “Public Water Distribution Systems, Assessing and Reducing Risks.” First Report, Committee on Public Water Supply Distribution Systems: Assessing and Reducing Risks, Water Science and Technology Board, National Research Council of the National Academies, The National Academies Press, Washington, DC.
NRC. (2006a). “Facing Hazards and Disasters: Understanding Human Dimensions.” Committee on Disaster Research in the Social Sciences: Future Challenges and Opportunities, Division on Earth and Life Studies, National Research Council of the National Academies, The National Academies Press, Washington, DC.
NRC. (2006b). “Drinking Water Distribution Systems: Assessing and Reducing Risks.”Committee on Public Water Supply Distribution Systems: Assessing and Reducing Risks, Water Science and Technology Board, National Research Council of the National Academies, The National Academies Press, Washington, DC.
NRC, 2007. “Improving the Nation’s Water Security: Opportunities for Research.” Committee on Water System Security Research, Water Science and Technology Board, National Research Council of the National Academies, The National Academies Press, Washington, DC.
Pickard, Brian. (2010). “Overview of the U.S. EPA Water Security Initiative.” World Environmental and Water Resources Congress, Providence, RI.
US EPA. (2008). “Water Security Initiative: Interim Guidance on Developing an Operational Strategy for Contamination Warning Systems." Office of Water (MC 140). EPA 817-R-08-002.