Engineering and Agriculture have been taught at UK since the university opened over 150 years ago. Building on that tradition, the Department of Biosystems and Agricultural Engineering features internationally recognized faculty members conducting research at the leading edge of technology. The Department of Biosystems and Agricultural Engineering educates engineers who ensure that the world has clean water systems, adequate food production, and sustainable energy sources. Undergraduate and graduate students who want to work in well-equipped laboratories, publish results in technical journals and present at international meetings will discover unique opportunities for solving problems within the globally critical food-energy-water nexus. Graduates have the opportunity to establish dynamic careers in industry and government. Students have been hired by many organizations, such as USDA, Alltech, Chiquita, Nestle, Kuerig, Yum! Foods, Duke Energy, UPS, Trane, Cummins, John Deere, Honeywell, Altec, LinkBelt and Big Ass Solutions.
UK Invites Community to Celebrate its 100th E-Day Open House
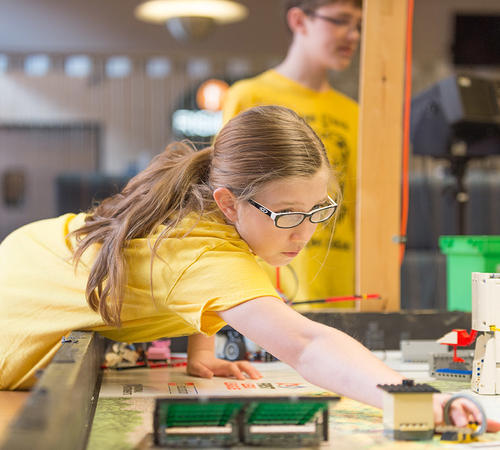
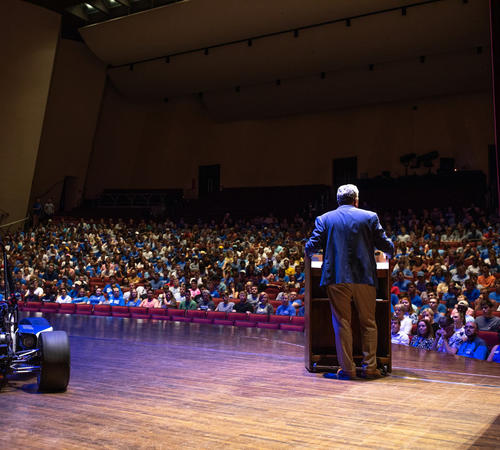
A decades-long tradition, UK Engineering held its first E-Day on May 26, 1921. The university dismissed classes at noon to allow the community to tour the college and see its researchers and students in action. Now, an estimated 3,000 people attend E-Day each year.
Fall 2022 Dean's List Includes 1,034 Engineering Students
The University of Kentucky has released its Dean's List for the Fall 2022 semester. A total of 5,631 students were recognized for their outstanding academic performance – 1,034 were from the College of Engineering.
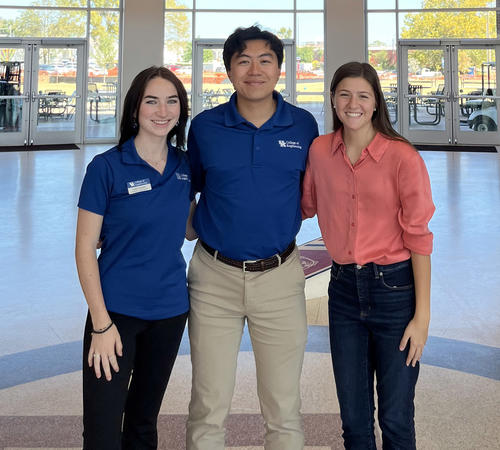
The Engineering Student Council Receives Awards at the National Association of Engineering Student Councils Conference
Three students representing the University of Kentucky Engineering Student Council (ESC) attended the National Association of Engineering Student Councils (NAESC) East Regional Conference earlier this month at Louisiana Tech University.