PART I. MULTIPLE
CHOICE
1.
Which of the following is not considered one of the four broad categories of
competitive priorities?
A. Technology
B. Cost
C. Time
D. Quality
E. Flexibility
2.
The impact of an organization’s strategy on the
organization is
A. Long-term
B. Medium-term
C. Short-term
D. Day-to-day
E. Temporary
3.
Productivity can be improved by
A. Increasing
inputs while holding outputs steady
B. Decreasing
outputs while holding inputs steady
C. Increasing
inputs and outputs in the same proportion
D. Decreasing inputs while holding outputs steady
E. None
of the above
4.
If inputs increase by 30% and outputs decrease by 15%,
what is the percentage change in productivity?
A. 100%
decrease
B. 11.54%
increase
C. 34.62% decrease
D. 15%
increase
E. 15%
decrease
5. For which of the following is break-even analysis
not appropriate?
A. Deciding
how much of a product must be sold to make a profit
B. Evaluating
different processes
C. Deciding
whether it is better to make or buy a product
D. Deciding
between different products
E. Deciding how to allocate overhead
6.
Insourcing incurs an annual
fixed cost of $500,000 and a variable cost of $60 per unit. Outsourcing incurs an annual fixed cost of
$750,000 and a variable cost of $20 per unit.
What is the indifference point between the two alternatives?
A. 1250
B. 12500
C. 6250 500,000
+ 60Q = 750,000 + 20Q
D. 62500
E. 40
7.
Which of the following is characteristic of
continuous operations?
A. Produce many different products with varying
processing requirements
B. Capital
intensive
C. Workers need to be able to perform different
tasks depending on the processing needs of the product
D. General purpose equipment
E. Volume of goods produced directly tied to
number of customer orders
8.
A company that is highly vertically integrated will
A. Own its raw material
sources, factories, and product distribution system
B. Be a supplier for manufacturing companies
C. Rely on vendors for raw materials and parts
D. Have a flat organization chart
E. Be a monopoly
9.
What refers to owning or controlling the channels of
distribution?
A. Backward integration
B. Vertical integration
C. Horizontal integration
D. Forward
integration
E. Enterprise integration
10.
What is the probability of a Type I error for a
control chart with limits set at ±
3 standard deviations from the mean?
A. 4.56%
B. 0.26%
C. 99.74%
D. 95.44%
E. Cannot be determined
11.
For which of the following would a control chart for
attributes not be appropriate?
A. Number of nonfunctioning light bulbs
B. Proportion of broken eggs in a carton
C. Number of rotten apples
D. Number of complaints issued
E. Length of
metal rods
12.
Suppose that you want to measure the percentage of
candles that are cut longer than 9 inches.
Which control chart would be appropriate?
A. Mean chart
B. Range chart
C. Count chart
D. Proportion
chart
E. Flow chart
13.
Which of the following is not a dimension of quality that we learned in class?
A. Quality of conformance to design
B. Quality of
production process
C. Post-sale service
D. Quality of design
E. Ease of use
14.
An executive conference center has the physical
ability to handle 1,100 participants.
However, conference management personnel believe that only 1,000
participants can be handled effectively for most events. The last event, although forecasted to have
1,000 participants, resulted in the attendance of only 950 participants. What is the conference facility’s capacity
utilization relative to its design capacity?
A. 100%
B. 86.4% (Effective capacity
= 1000; design capacity = 1100; actual output = 950; Utilization(Design)=950/1100)
C. 95%
D. 110%
E. 90.9%
15.
The maximum output rate that can be achieved by a
facility under ideal conditions
A. Utilization
B. Effective capacity
C. Design
capacity
D. Ultimate capacity
E. Temporary capacity
16.
Which of the following is not a determinant of effective capacity?
A. Scheduled machine maintenance
B. Lunch breaks
C. Realistic work schedules
D. Regular staff levels
E. Overtime
(Effective capacity: output under normal condition)
PART
II. PROBLEM SOLVING
Question
1.
C&A
bakery produces 1500 loaves of
bread a month. Labor productivity is
2.344 loaves per labor-hour. Each worker
works 160 hours per month for $8 per hour.
Utility costs $500 per month. Ingredients cost $0.35 per loaf.
(a)
How many
workers do C&A currently use?
(b)
What is C&A’s multifactor productivity?
(c)
How many
workers will C&A need to add in order to meet an anticipated 25% increase
in bread demand?
(d)
What is C&A’s multifactor productivity with an increase in
labor suggested in (c)?
(e)
Compare
the change in productivity between (b) and (c).
(a) Outputs/Inputs = Productivity
Given: Outputs = 1500 and
Productivity = 2.344 loaves per labor-hour
Thus, Labor-hours = 1500/2.344 = 640
hours
Given: each worker works 160 hours
per month
Thus, number of workers used =
640/160 = 4
(b) Multifactor productivity = Outputs/(Labor cost + Utility cost + Ingredients cost)
Output = 1500 loaves
Labor cost = 640 hours x $8
Utility cost = $500
Ingredients cost = 1500 x $0.35
Thus, multifactor productivity =
1500/6145 = 0.244
(c) New output = 1500 x (1+25%) = 1875
Labor-hours
needed = 1875/2.344 = 800 hours
Number
of workers needed = 800/160 = 5
è Need to add 1 worker
(d) Multifactor
productivity = Outputs/(Labor cost + Utility cost +
Ingredients cost)
Output = 1875 loaves
Labor cost = 800 hours x $8
Utility cost = $500
Ingredients cost = 1875 x $0.35
Thus,
multifactor productivity = 1875/7556.25 = 0.248
(e) Change
in productivity = (0.248-0.244)/0.244 = 1.6%
(a) TC_manual = $15000
+ ($350+$350) x 200 = $155000
TC_semiautomatic
= $35000 + ($330+$270) x 200 = $155000
TC_automatic =
$80000 + ($350+$130) x 200 = $176000
Either the manual and semi-automatic production method gives the lowest
total costs. C&A can choose one of
these methods.
(b) From (a), when Q1=200 is the indifference
point between manual and semi-automatic
Let Q2 be the indifference point between
semiautomatic and automatic method
i.e., 35000 + 600 Q2 = 80000 + 480 Q2
Q2 = (80000-35000)/(600-480)
= 375
Thus, 1 <= Q <= 200 choose manual
200 <= Q <= 375 choose semiautomatic
Q >= 375 choose automatic
(c)

(d) R = 800 Q
(e) Let Q be the break-even point when revenue
equals to total costs
i.e., 800 Q = 15000 + 700 Q
Q = 15000/(800-700) =
150
(f) Profit = Revenue – Total costs
= 800 x 1000 – (15000 + 700 x 1000)
= 800000 – 715000 = 85000
Question
3.
100 IRS
representatives are monitored daily.
Incidents of incorrect information or impoliteness to customers are
recorded. The data for last week are:
|
Day
|
Number
of Non-conformities
|
|
1
|
52
|
|
2
|
27
|
|
3
|
35
|
|
4
|
44
|
|
5
|
55
|
(a)
What
kind of control chart should be used? Explain why.
(b)
Construct
a three-sigma control chart.
(c)
What
does the chart tell you?
(d)
If 65
nonconformities are recorded the next day, should any special action be taken?
(a)
The quality characteristic here is the “number of non-conformities”
which is counted on a discrete scale.
Thus, a control chart for attribute should be used. The number of non-conformities is counted
daily. Thus, a c-chart should be used.
(b)
CL = (52 + 27 + 35 + 44 + 55)/5 = 42.6
UCL
= 42.6 + 3  = 62.2
LCL
= 42.6 - 3 = 23.0
(c)
The chart is defined by a center line of 42.6, an upper control limit of
62.2 and a lower control limit of 23:
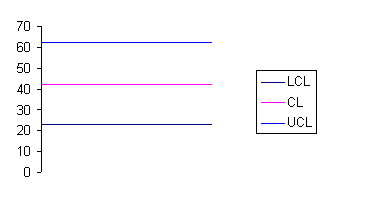
(d) 65 nonconformities go beyond
the UCL of 62.2, indicating that a quality problem exists
that needs special attention.
Question 4.
C&A, a cellular
phone manufacturer, is investigating the possibility of producing and marketing
a new line of phone. Undertaking this project
will require either purchasing a CAD/CAM system or hiring and training several
additional engineers, or purchasing a CAD/CAM system after a pilot study. The market for the product could be either
favorable or unfavorable. With favorable
acceptance by the market, sales would be 25,000 phones selling for $100 each,
and with unfavorable acceptance, sales would be only 8,000 phones selling for
$100 each.
The cost of the
CAD/CAM equipment is $500,000, but that of hiring and training three new engineers
is only $375,000. However, manufacturing
cost should drop from $50 each when manufacturing without CAD/CAM to $40 each
when manufacturing with CAD/CAM. The
probability of favorable acceptance of the new phone is 0.40; the probability
of unfavorable acceptance is 0.60.
The other option is
to conduct a pilot study and then decide whether or not to purchase a CAD/CAM
system. The pilot study will cost
$10,000. C&A will purchase the
CAD/CAM system only if the result of the pilot study is positive. The probability of a positive pilot study is
50%. At this time, the probability of
favorable acceptance of the new phone will be increased to 70%. All other costs and sales figures remain the
same.
(a)
Draw a
decision tree showing the decision, chance events, and their probabilities, as
well as the profitability of outcomes.
(b)
Solve
the decision tree and decide what C&A should do.
(a)
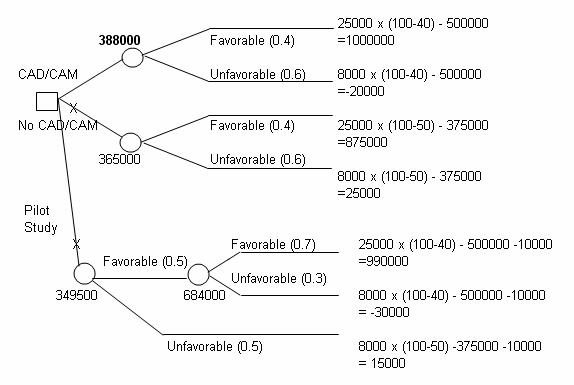
(b) C&A should
produce and market a new line of cellular phone by purchasing a CAD/CAM
directly. The expected profit is
$388,000.