11 BROOKINGS á May
2008
Residential
Per Capita Footprints for 100 Metros
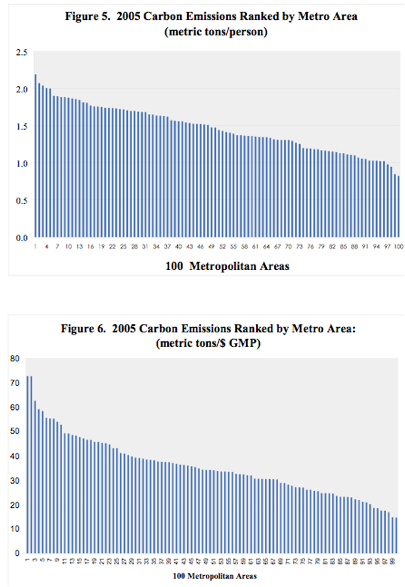
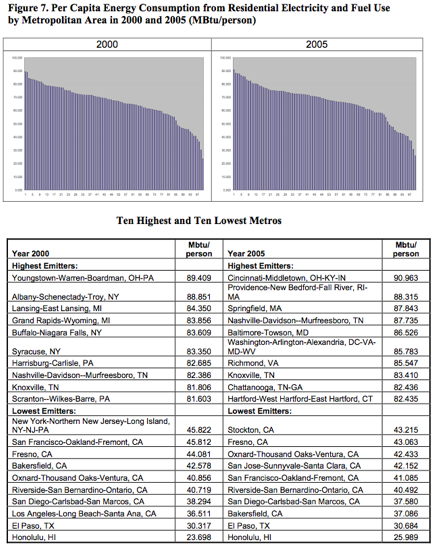
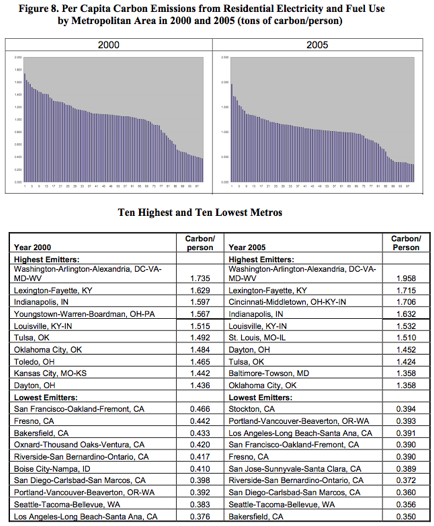
Compare Figure 7 and Figure
8: Lexington Metro areas is not represented in terms of overall fuel use (in
the top 10).
This Changes when Carbon
Emissions are considered as a part of the calculation: Why?
General:
Carbon
intensity of fuels and energy sources
Cost
of fuels in overall economic terms: how calculated?
Housing
i. carbon intensity of fuel source by region
a. electricity
b.
home heating
ii.
Climate and
energy use by region: cooling degree-days and heating degree days
iii.
Electricity
prices: why does KY have such low electricity prices? Why is coal cheap?
iv.
Metropolitan
AreaÕs urban form
a. Population density,
number of persons per acre of developable land
b.
housing
density, number of housing units per acre of developable land
c. job density, number of
jobs per acre of developable land
d.
Population
concentration
National Stats:
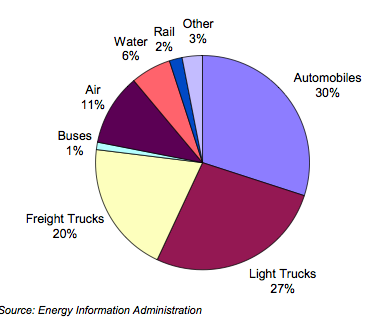
Transportation responsible for
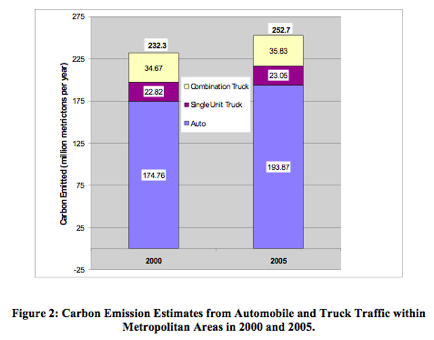
one-third of 534 million metric tons CO2 emissions 2005.
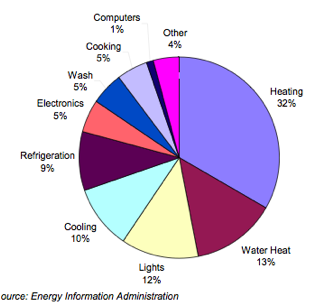
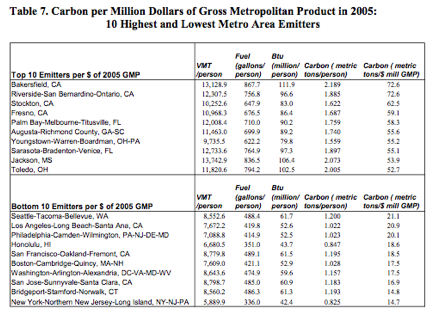
Gross Metropolitan Product