Lesson Eleven: Crater Number Density
Lesson Description
Students are introduced to the concept of number density, then use this concept to identify the relative surface age of three regions on Mars.
Instructions
Today we will learn some math that is necessary in order to learn important things about objects in the Solar System. Have you ever learned a new idea in math class and wondered what is this going to be good for? When will I ever use this? The math that you are learning in this lesson is very important to understanding why planets and moons in the Solar System look the way they do.
Begin this lesson by taking a normal piece of notebook paper and drawing 200 X’s on the paper. Spread the X’s out so they completely fill the paper. An example of this can be seen in Figure 1. When you are doing this it might be best to fill the paper and then search out regions that look like there are fewer X’s.
When you are finished each group member should measure the sides of the paper to see how big it is on each side. Make the measurement in centimeters. Using the various measurements in the group decide on a final, best value for the lengths of the paper. Record this data for later use.
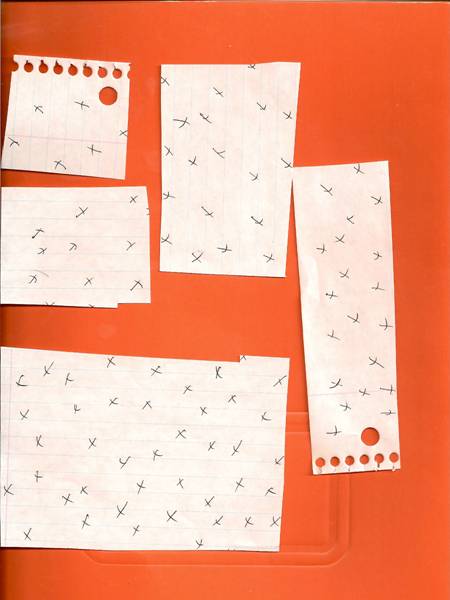
Next use scissors to cut your paper into about 10 pieces. Make the pieces either square or rectangular, but be sure you make a variety of sizes. (See Figure 2).
When you are finished cutting up the paper divide the pieces up as equally as you can between group members. Each member should now count up the number of X’s on each of their pieces of paper. Write that number on the piece of paper.
Analysis:
- Now compare the number of X’s on each piece of paper within your group. Who had the most X’s?
- Who had the least number of X’s?
- Did any of the pieces have the same number of X’s?
- Compare the pieces of paper by grouping them together according to the number of X’s you found. Try to come up with an explanation for why some pieces had more X’s and some had less? Write down your reasoning.
- After you finish this discuss with your teacher you’re the answer that you gave.
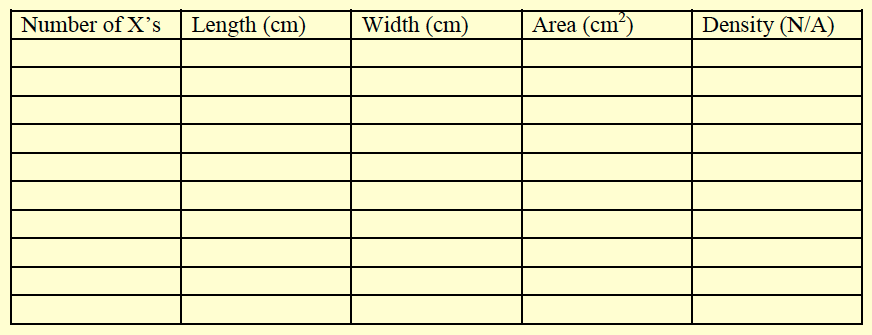
- Next use your rulers to measure and record the length and width of each piece of paper. Use these measurements to compute the area of each piece of paper. Write your data in Table 1. (Leave the final column which says “Density” blank for now)
- From your previous discussion concerning why some pieces of paper have more X’s than others, decide in your group what property of the paper listed in your table determines if there will be more or less X’s and explain why this is the case.
- To further explore your answer, pick one of your small pieces of paper and one of your largest and compare the area of the two. Roughly how many of the small pieces of paper would it take to cover the large piece? In other words, how many times bigger in area is the big piece when compared to the small piece of paper?
- Now compare the number of X’s on the small piece of paper to that of the big piece of paper. How many times more X’s appear on the big paper than on the small paper? In other words, what number would you have to multiple the small number of X’s by in order to get the large number of X’s. How did you compute this number?
- Now look back at your comparison of area and your comparison of the number of X’s for the two pieces of paper. Do the two values have anything in common? What?
- Use your data table to make a graph. Put on the x-axis the Area of the Paper and on the y-axis the Number of X’s. Now you need to interpret the graph. Write what happens to the number of X’s when the Area of the Paper gets larger.
- At this point it may seem clear that as the area of the paper gets larger, so does the number of X’s on the paper. There is a way to learn something about the number of X’s no matter how big the paper is. This can be done by finding the density of X’s on the paper. This can be done by dividing the Number of X’s by the Area of the Paper.
- Compute the Density and fill in the last column of the Table from above. What do you notice about the density for all pieces of paper?
- Now consider the original piece of paper which had 200 X’s. Try to predict whether the density of X’s will be higher, lower or about the same when compared to the smaller pieces of paper. Explain your answer.
- Go ahead and calculate the density of X’s for the original sheet of paper. What did you find?
- Now think about density. What would you have to do to make the density of X’s to be a lot larger or smaller?
- Why didn’t all the pieces of paper have exactly the same density as each other or the original sheet of paper?
- Which pieces of paper were the closest in density to the original sheet of paper and which were the most different? Explain why you think this might be the case.
Replacing X’s with Impact Craters.
In past lessons we have examined impact craters on the Moon, Mercury, Venus, Earth, Mars and four of Jupiter’s moons. Let’s recall a very important scientific principle which you have developed and which we can use to learn even more about planets and moons.
- Compare the number of craters on the Jupiter moon of Europa to that of our Moon. Is the number of craters different, and what does this tell us about Europa’s surface compared to our Moon’s surface? (See Images from Lesson Ten) Explain your answer carefully.
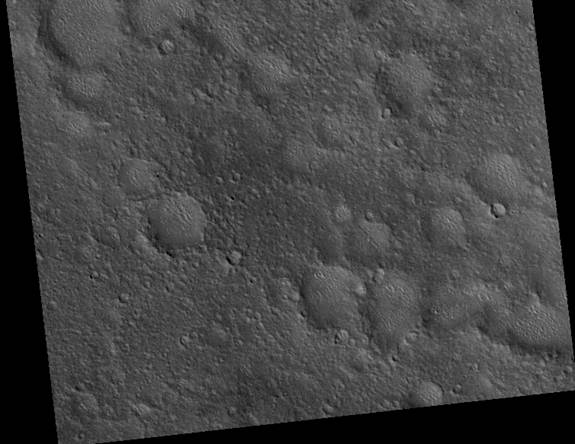
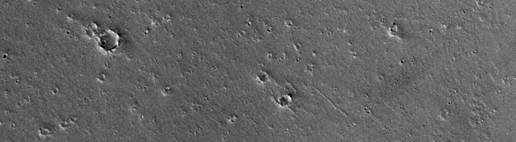
- Now we will play a little game. Here are three images (1, 2, 3) from the surface of Mars taken by a satellite in orbit around Mars called the Mars Orbiter Camera (MOC). These images are from the High-Resolution camera and show extreme close-ups of the Martian surface. Two of the images are from places on the surface which are only about 100 km apart from each other. The other image is taken from a region that is on the other side of Mars. Look carefully at all three images. Can you tell which two are near each other and which one is very far away? What evidence can you give for your answer? Write out a good scientific reason for this answer.
- You have probably noticed that the three images are not the same size. Because of this, is it fair to say that one image is different from the others because there are MORE craters in one than another? Think carefully about the number of X’s that you found on different size pieces of paper. What would be a better way to deal with the number of craters?
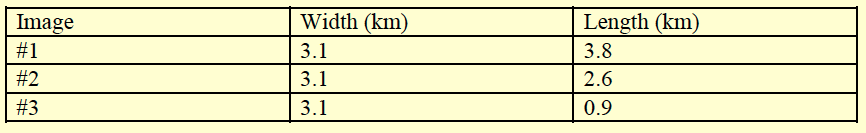
- Here is a table that shows the size of each of the images in kilometers.
- Now really analyze the three images. One problem that occurs when trying to use crater counts in an analysis is deciding what is a crater and what isn’t. This is especially a problem when you try to count very small craters because some of the images are clearer than others. To avoid this problem we will only count the craters that have a diameter which is greater than 50 meters. A crater in the image which has a diameter greater than 50 km will appear to be larger than 2 millimeters. So you want to count only those craters which are larger than 2 millimeters.
- Count all the craters with diameter greater than 50 meters in each of the three images. Then use what you have learned in this lesson to make a determination of which images are near each other and which is not. Show your work and explain your results.
Final Conclusions
- With your data can you say anything about the relative surface age of the region where the two similar images where taken compared to the age of the region where the other image was taken? Explain your reasoning.
- The two images that are of similar age were taken near Olympus Mons. Olympus Mons is the largest volcano in the entire Solar System. The other image is taken inside the Gusev crater, far from Olympus Mons. Can you think of a reason why the crater density near Olympus Mons maybe different than the one in Gusev crater?
- Now you can begin to learn something about the age of various surfaces on Mars. Why is it important in such a study to use crater density instead of just the number of craters in the image?
 Lessons created by:
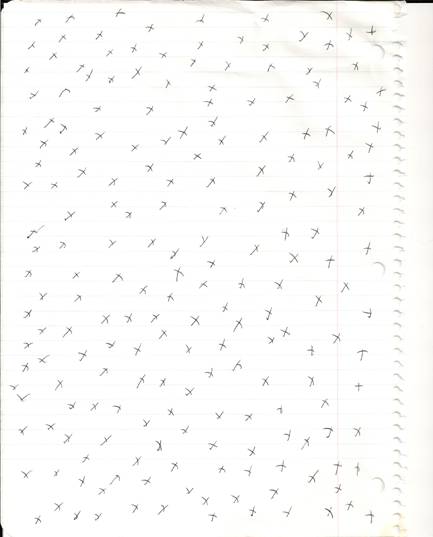