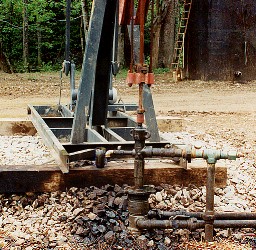
Detail of a producing well. Click for more information.
This is an Excel workbook with counts of the numbers of wells permitted and completed in Kentucky beginning with 1980. It includes production data by county except for 2007 (which is proprietary until 2009). A new page has been added to the workbook that contains the cumulative production summary by county for all years of available data.
Prepared data summaries for previous years (This service has been discontinued and no similar updates are planned. Download the Activity Summary spreadsheet for the most current data or use the oil and gas well data search service.):Oil and Gas Data (PTTC)
Oil and gas activity summary data formerly provided in the KGS PTTC pages is being updated and replaced. See the Activity Summary Spreadsheet for current information.
- How to use the oil and gas well record data search pages.
- Search oil and gas well data--access to well record data
- Search well data by location with interactive map server
- Free ArcView shape files (spatial data for mapping, NAD83, geographic)
- Download oil and gas well location data (KYOG_*.zip)
See the introductory page for more information.. - Base maps
- COUNTY.ZIP - County outline
- CARTER1.ZIP - Carter coordinate 1-minute grid (What is a Carter coordinate anyway?)
- CARTER5.ZIP - Carter coordinate 5-minute grid
- QUADSKY.ZIP - Topographic quadrangle grid
- Other shape files are available
- Carter coordinate to latitude-longitude conversion routines
- TORIS - oil field data
- PTTC Virtual Regional Resource Center - gateway to petroleum data
- Oil and Gas Maps - Exploration and development tools
- Big Lime Project stratigraphic tops data
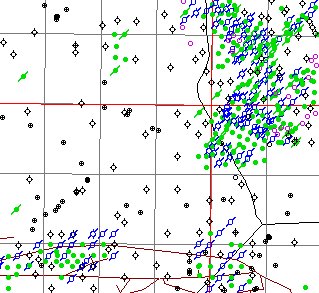
Click image to download maps